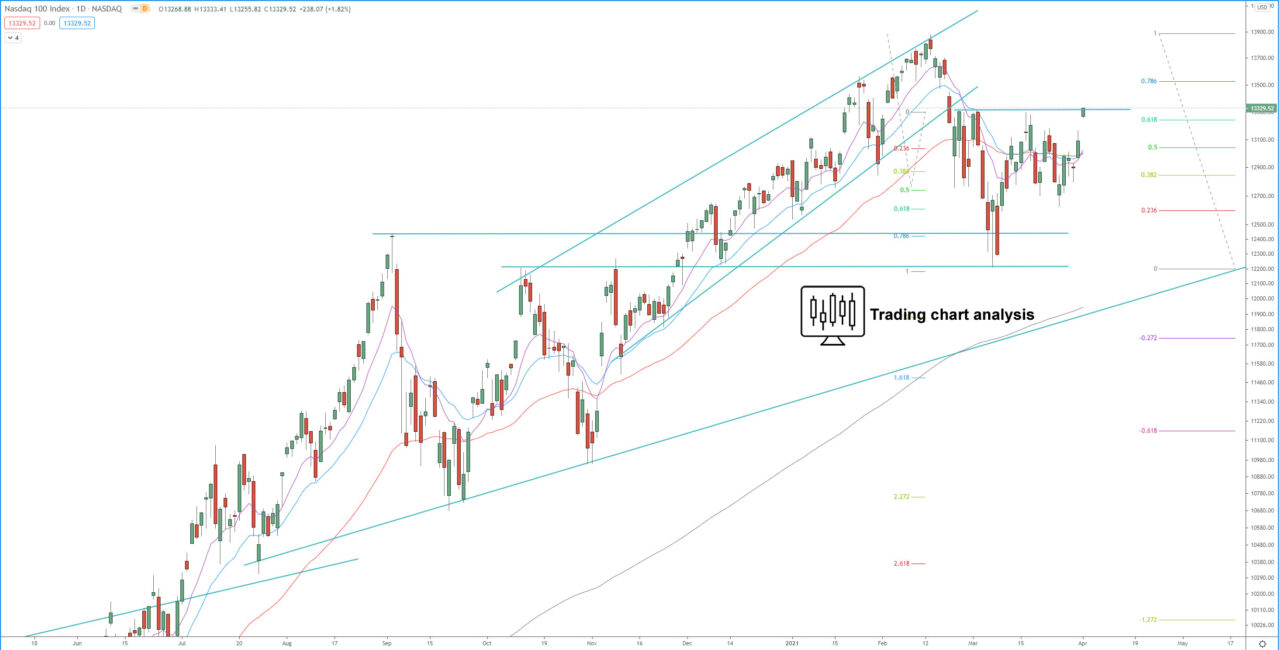
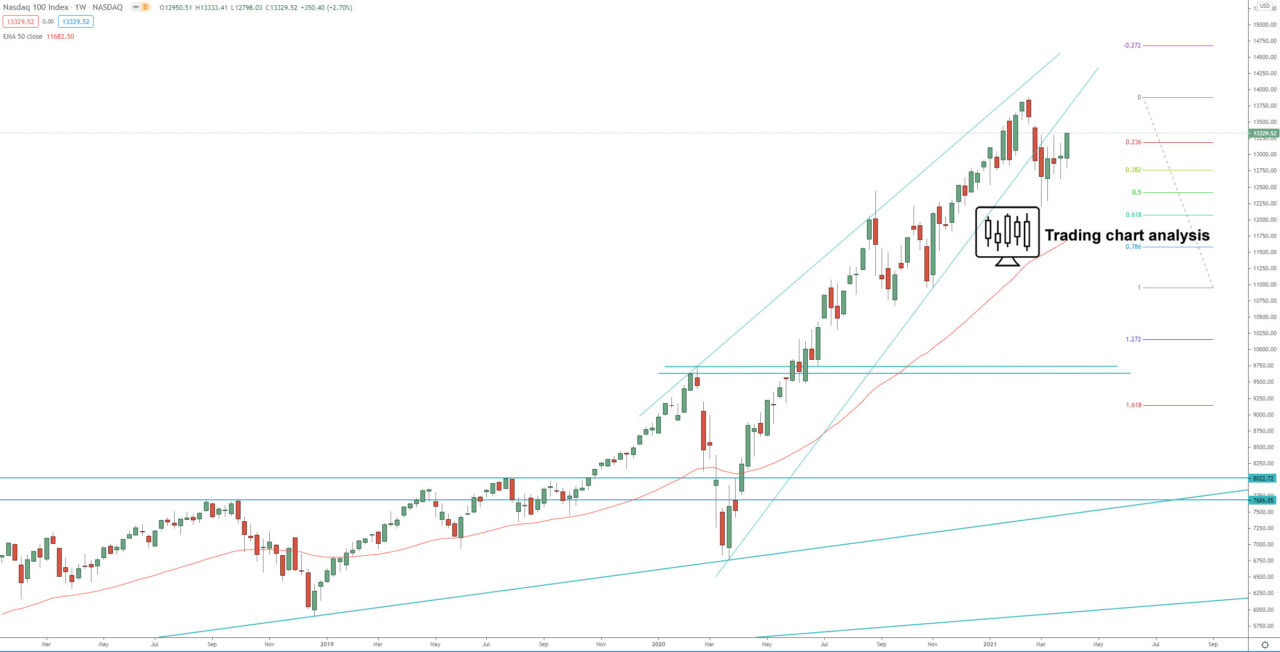
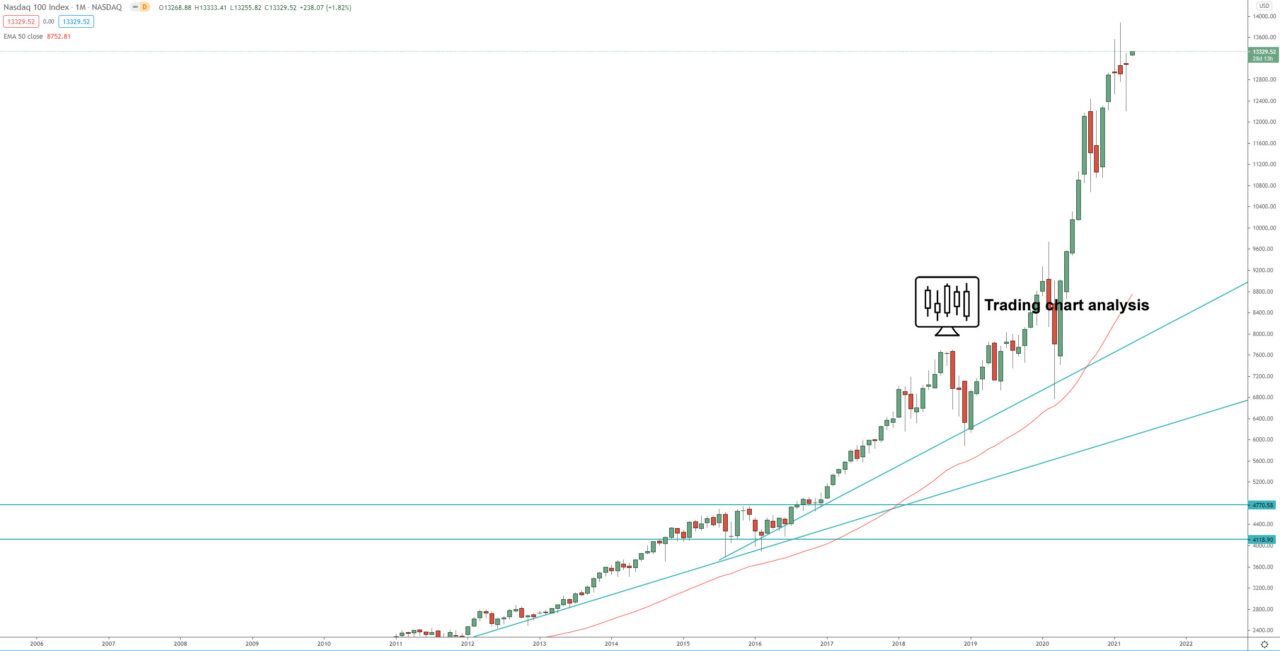
Technical analysis for the index NASDAQ 100 is showing that the index broke above key resistance, above 13 312, which is a signal for resumption of the daily bullish trend. The first target of this breakout is the previous daily high at 13879, the second target is at 1.272 FIB extension of the daily break out at 14 015, and the third target is at 1.618 FIB extension at 14 400. The tweezers tops on the monthly chart are still a concern.
On the other hand, if the NASDAQ 100 index breaks below 12 627, it will resume the daily bearish run and send the price to the previous low at 12208, if the index break below 12 208, further declines are in favor, toward 1.272 FIB extension at 11 880.
Review our technical analysis for the index NASDAQ 100 for our 2021 targets.
Daily chart:

Weekly chart:

Monthly chart:


