|
Getting your Trinity Audio player ready...
|
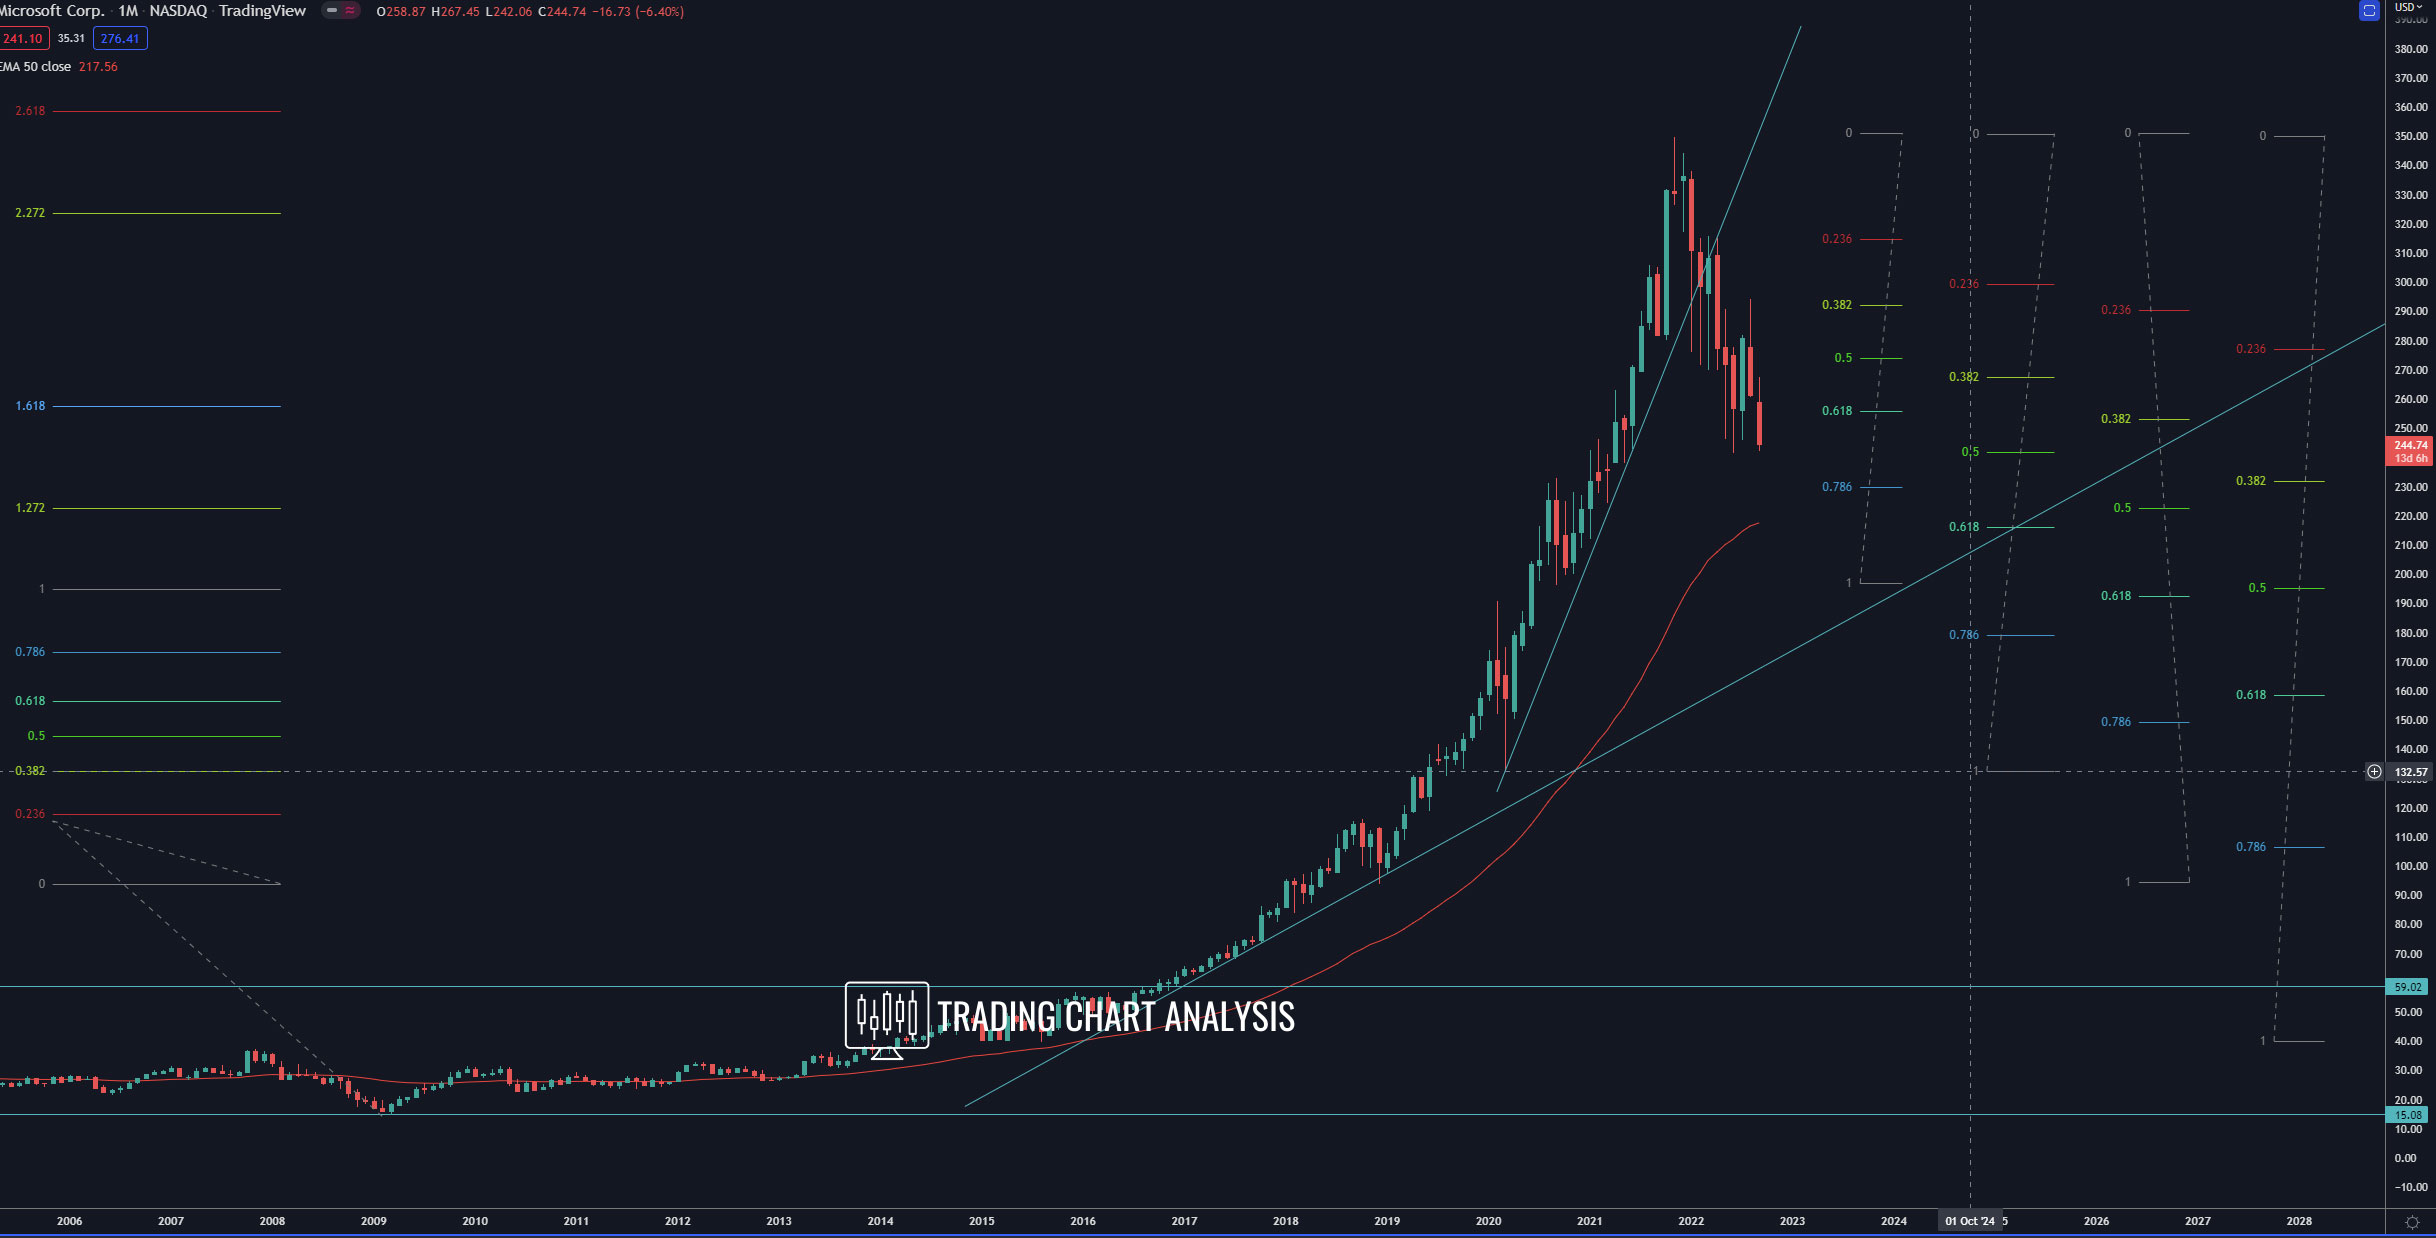
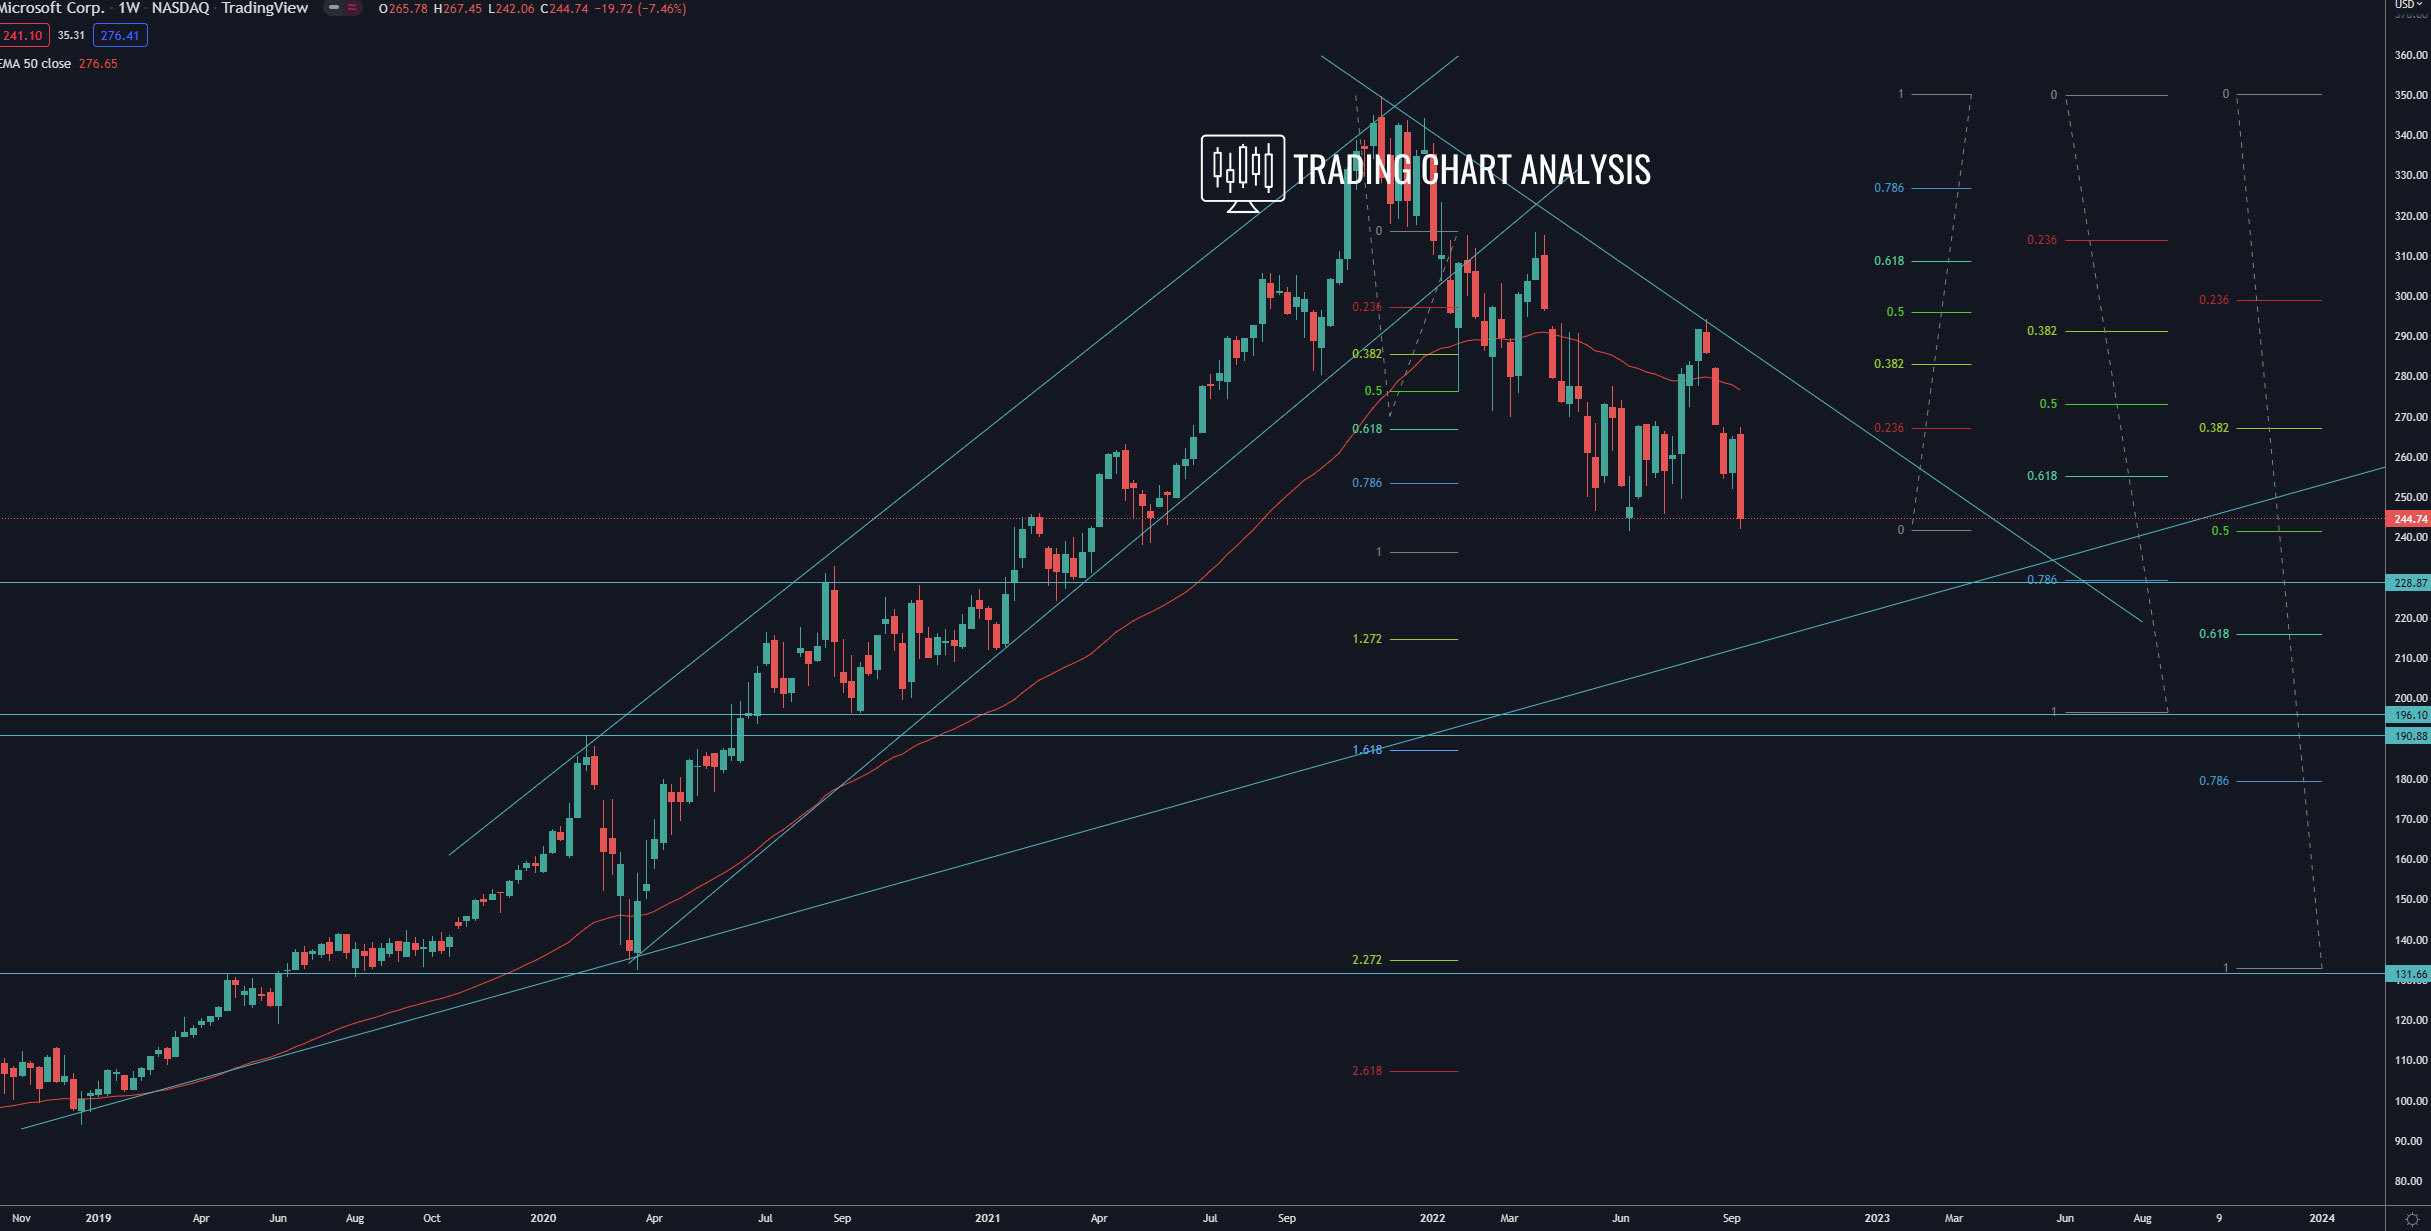
Technical analysis for Microsoft (MSFT) stock, the price formed a Head & Shoulders pattern on the weekly chart and broke below the neckline, starting a bearish wave. The first target of the bearish wave on the weekly chart is the 1.272 FIB extension at 215$, which is a 0.618 FIB retracement from the 2020 low. The second target is the 1.618 FIB retracement on the weekly chart at 187$. The third target for the bearish wave in the Microsoft stock is the 2.272 FIB extension on the weekly chart at 135$. Before that, we have dynamic support, which matches the support zone, around 215$, and therefore will be watched closely by market participants.
The zone between 280$ and 310$, where we have the previous weekly high, the 0.618 FIB retracement, and a descending trend line, is a key resistant zone the shares of Microsoft (MSFT).
Weekly chart:
Monthly chart: