|
Getting your Trinity Audio player ready...
|
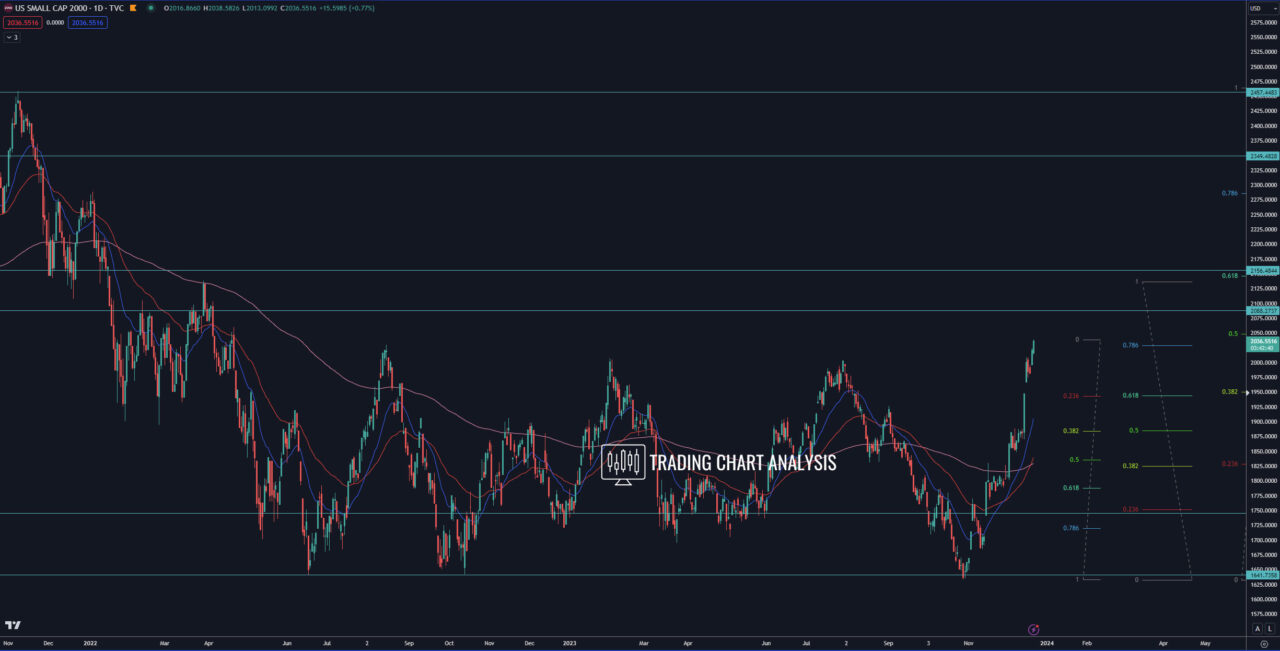
Technical analysis reveals a bullish breakout in the daily chart for the Russell 2000 index. Breaking free from consolidation, the index initiates a bullish run, targeting key Fibonacci retracement levels and charting a course towards new heights.
Bullish Breakout Unveiled: Targets and Trends
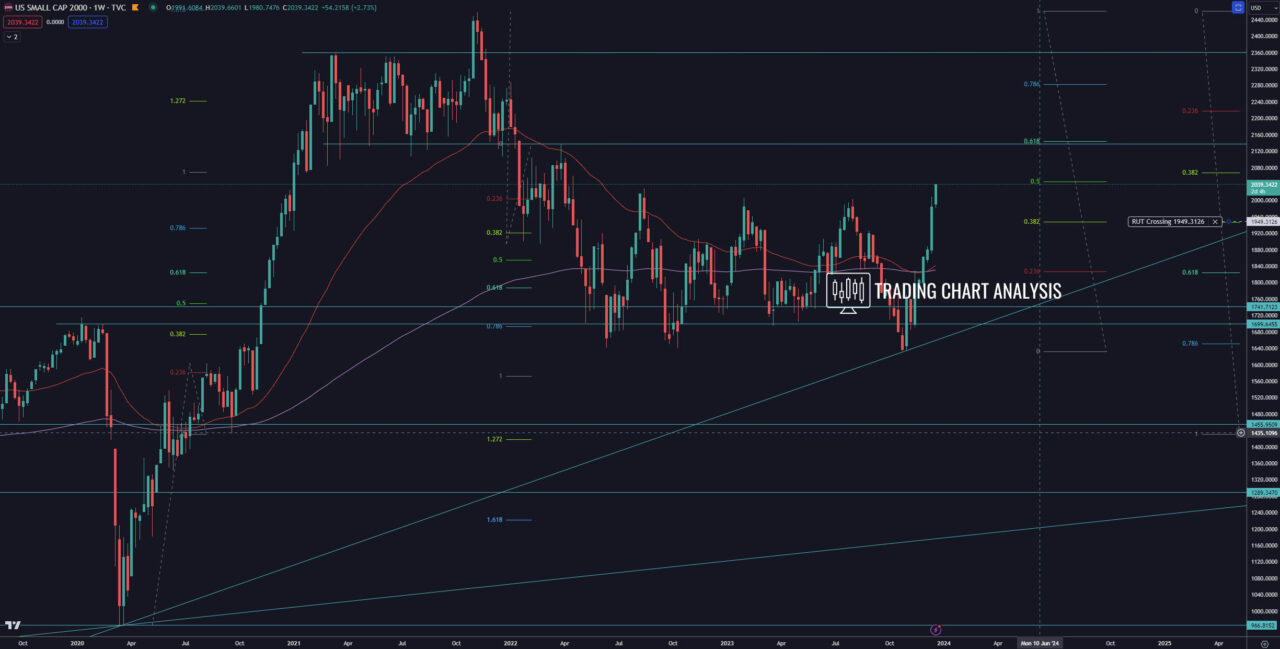
- Primary Target: 0.618 FIB Retracement on the Weekly Chart (2145) The initial goal for this bullish surge aligns with the 0.618 Fibonacci retracement on the weekly chart, strategically positioned around 2145. Notably, this level corresponds to 2138, marking the onset of the third bearish leg down on the weekly chart, following a preceding bearish breakdown.
- Secondary Target: 0.786 FIB Retracement (2280) Advancing further, the second target for this bullish breakout is the 0.786 Fibonacci retracement at 2280.
- Tertiary Target: Previous All-Time High (2458) The third target is set at the previous all-time high, standing at 2458, a pivotal level in the index’s historical performance.
Long-Term Perspective: Monthly Chart Insights
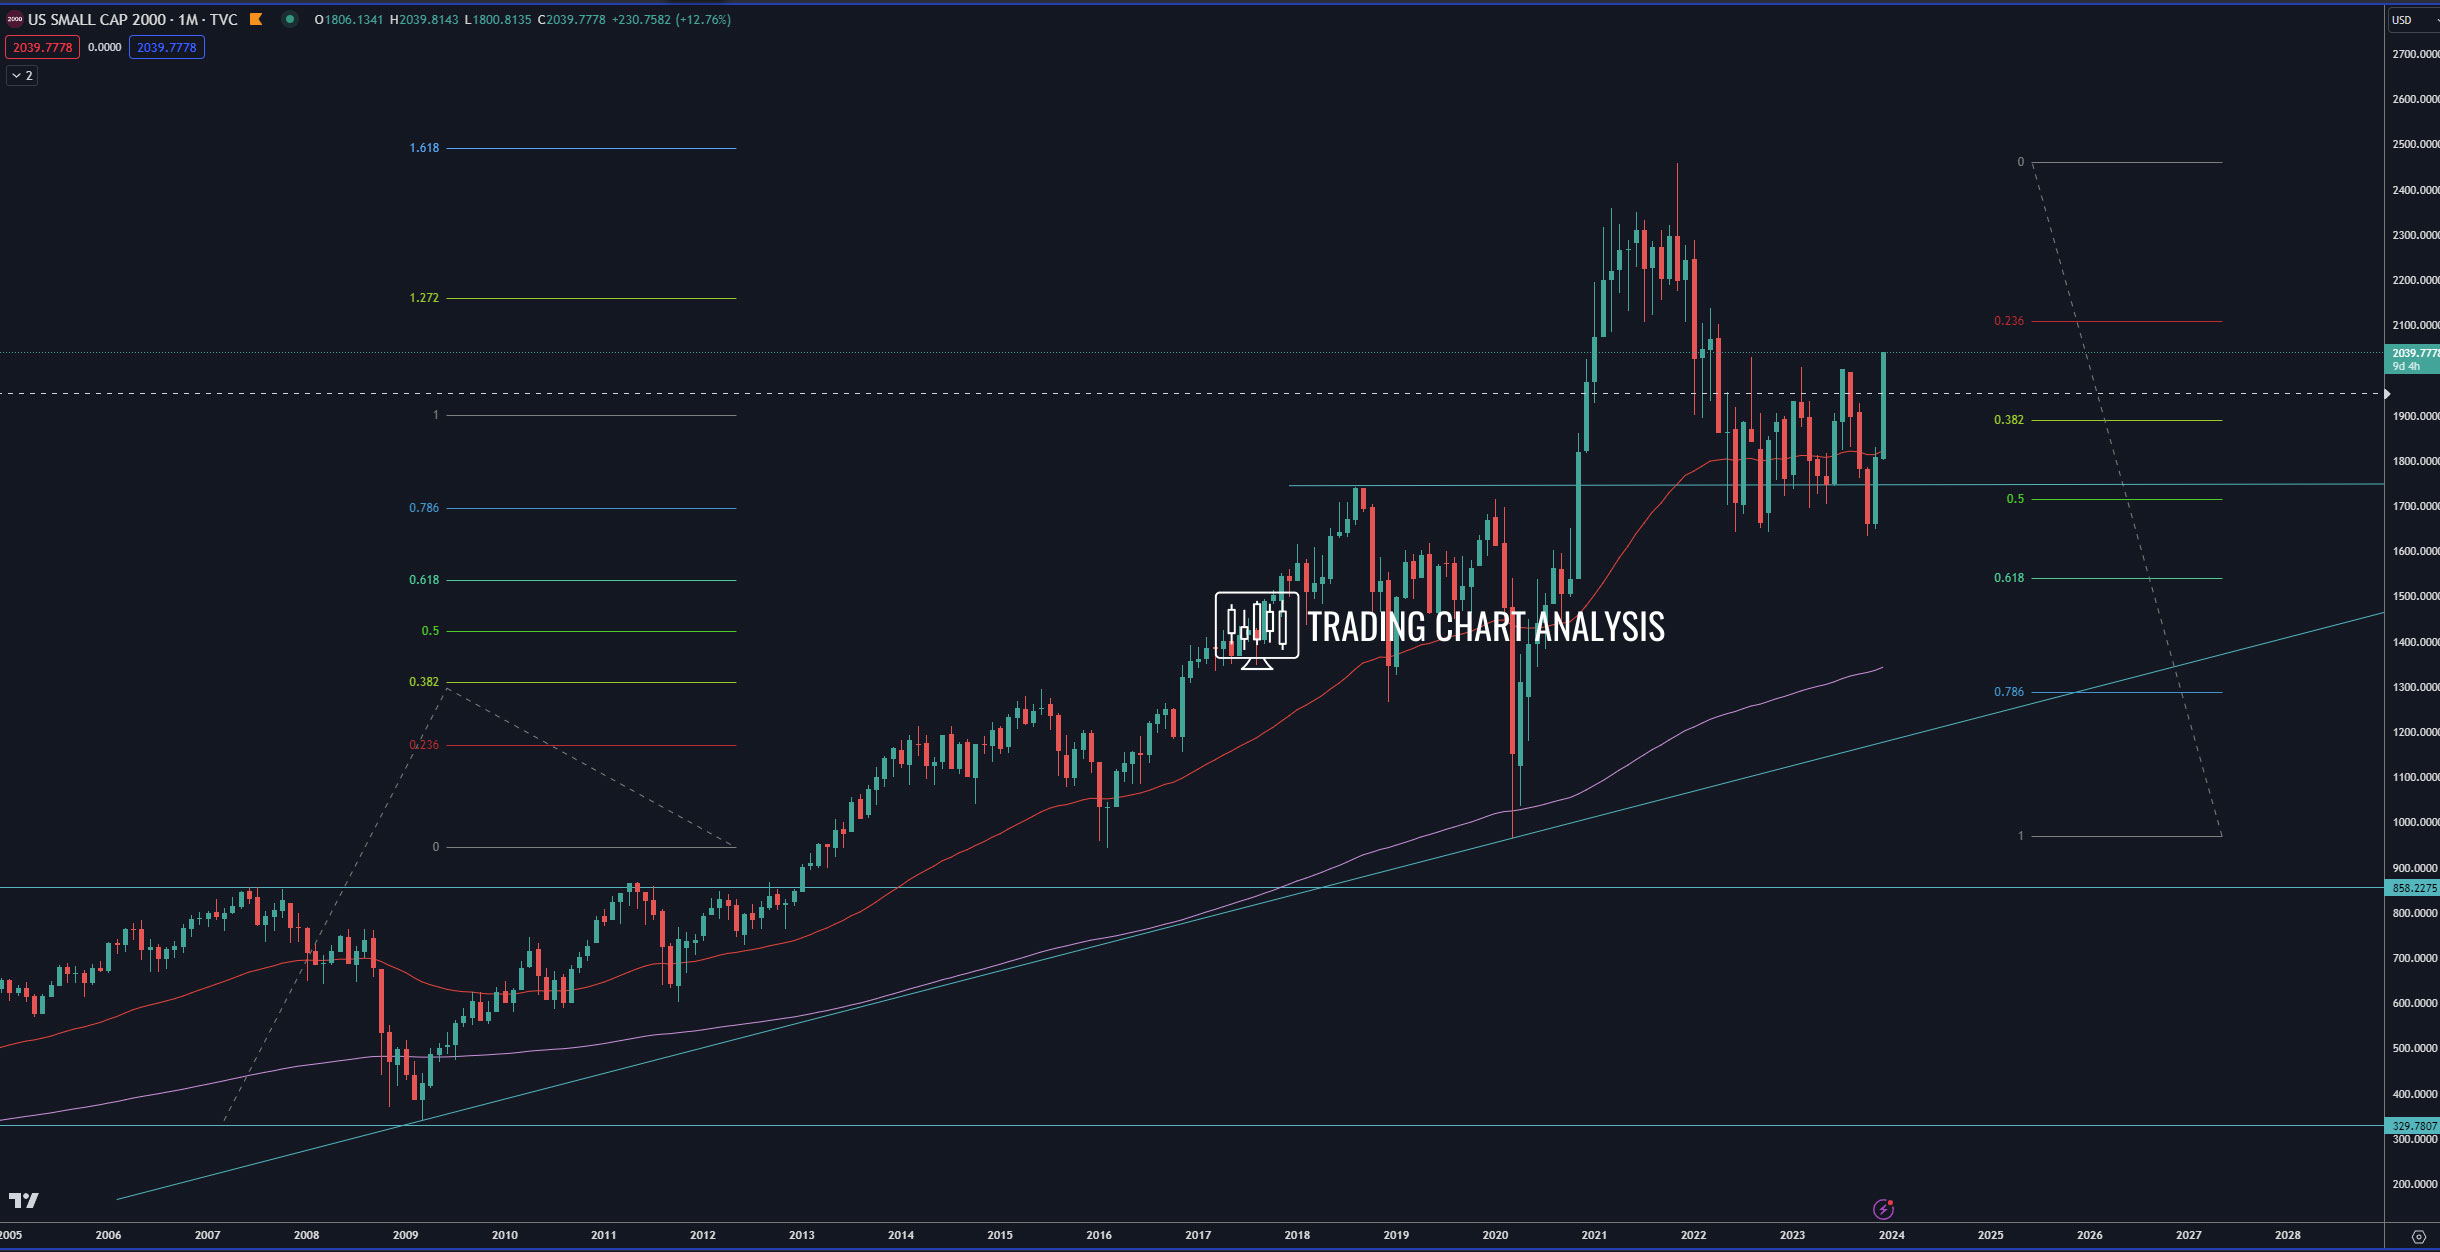
Zooming out to the monthly chart, a broader perspective emerges. The Russell 2000 finds itself within the third bullish wave. While the second target of this wave, the 1.618 Fibonacci extension at 2490, was nearly reached in 2021, breaching the previous all-time high at 2458 will unlock the door for a bullish run toward the second target of the third bullish wave – the 2.272 Fibonacci extension around 3100-3120.
Risk and Retracement Strategies: Downside Considerations
On the downside, attention turns to a gap in the daily chart around 1948. A retracement to fill this gap could present a bullish opportunity, serving as a potential continuation of the breakout. In times of retracement, focus on Fibonacci retracement levels becomes paramount for optimal entry points.
Cautious Optimism: Confirming the Breakout
Caution is advised against a false bullish breakout. Observing the weekly chart for a close above the consolidation range in 2030 is crucial for confirming the breakout on the daily chart. A rejection at 2030 on the weekly chart raises concerns and warrants a careful reevaluation.
Bearish Scenarios: Preparing for Downturns
Conversely, a break below the previous weekly low at 1633 signals a potential bearish run. Targets on the downside include the 0.618 Fibonacci retracement on the monthly chart at 1540 and further down toward the 0.786 Fibonacci retracement at 1290.
As we navigate the intricacies of the Russell 2000 index, a holistic approach combining technical precision and strategic foresight is key to capitalizing on emerging opportunities and mitigating risks.
Daily chart:

Weekly chart:

Monthly chart:


