technical analysis – 7 – 13 FEBRUARY 2021
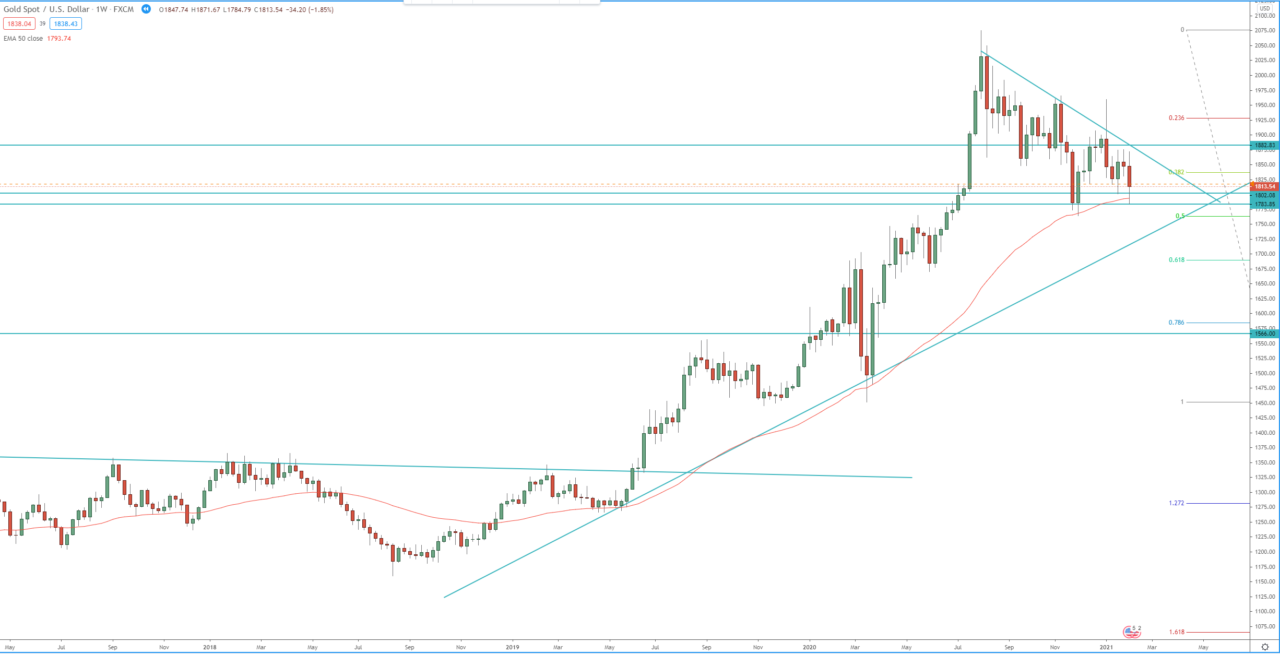
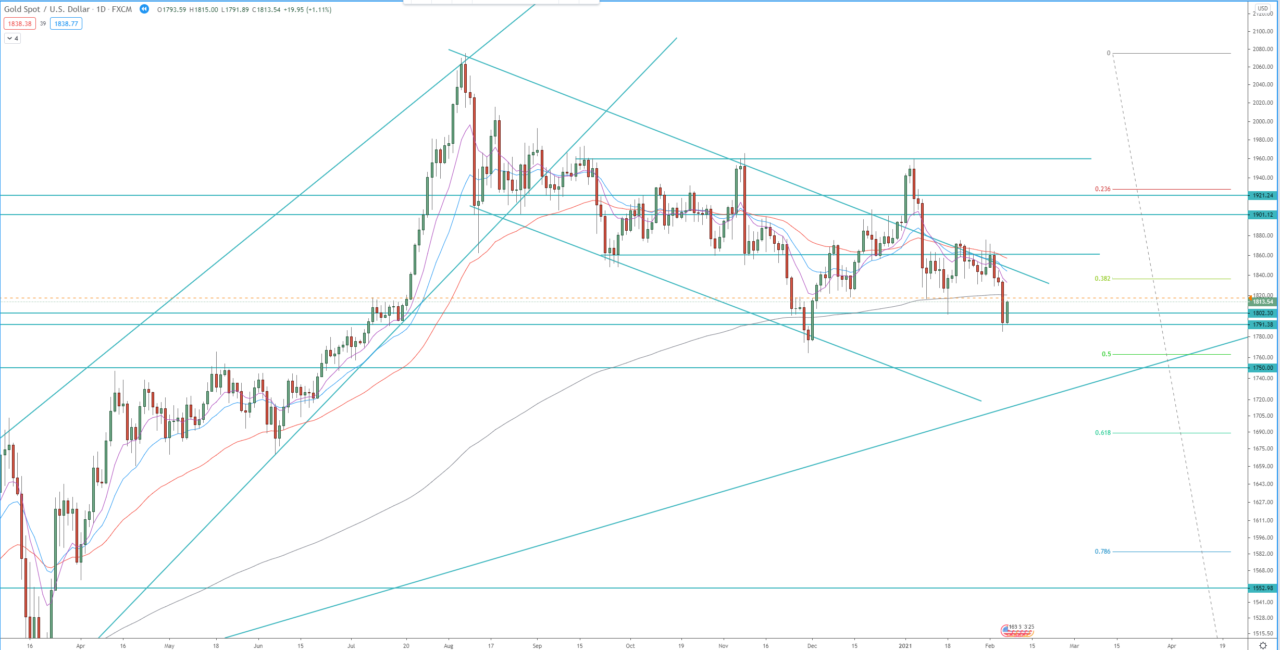
The price is approaching the previous weekly low and support zone between 1765 – 1800. If we see a rejection of that weekly/daily low at 1765, that could be a potential double bottom and the first signal for resumption of the bullish trend.
Break above the previous daily resistance, above 1876, and above the dynamic resistance will confirm the resumption of the bullish trend with a target, previous weekly high at 2074.
On the other hand, a break below 1765, will send the price lower, toward the dynamic support and 0.618 FB retracement around 1690.
Review our 2021 technical analysis for the long-term view.
Weekly chart:

Daily chart:


