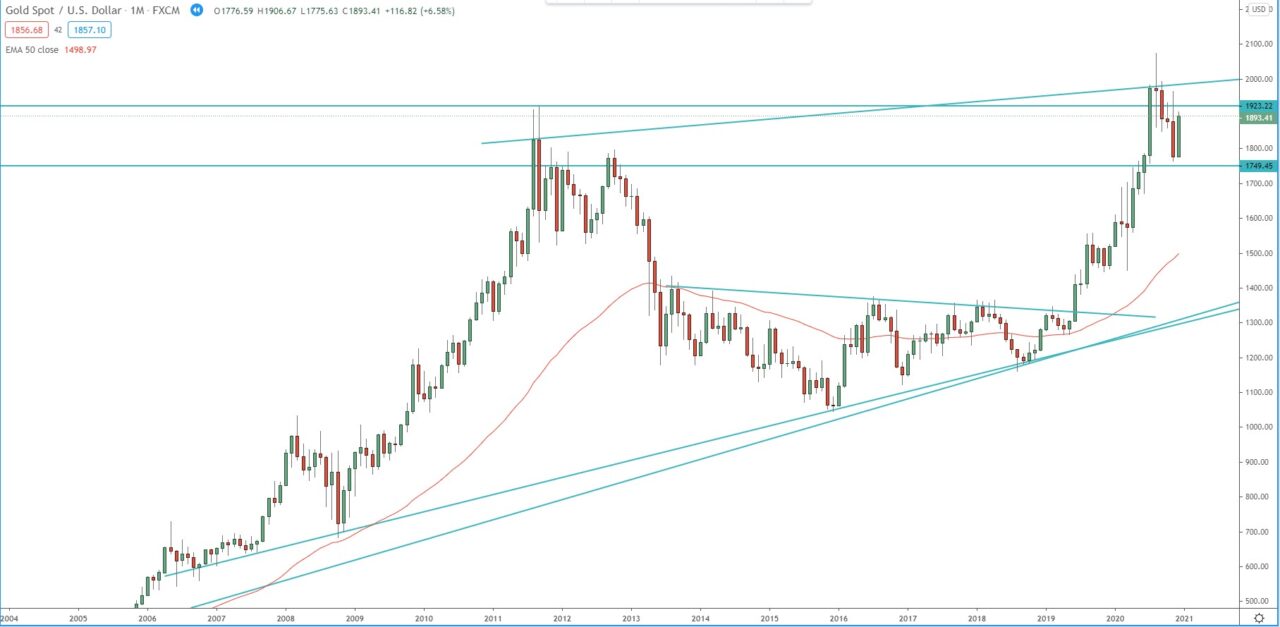
Looking at the monthly chart, we can see that after the break out, above the strong resistance around 1370, which we witnessed in June 2019 the price accelerated to the upside. The bullish momentum was strong enough to carry the price toward and beyond the all-time high above 1920. However, after the break above the previous all-time high, the price formed doji candle on the monthly chart and pulled back, starting consolidation.
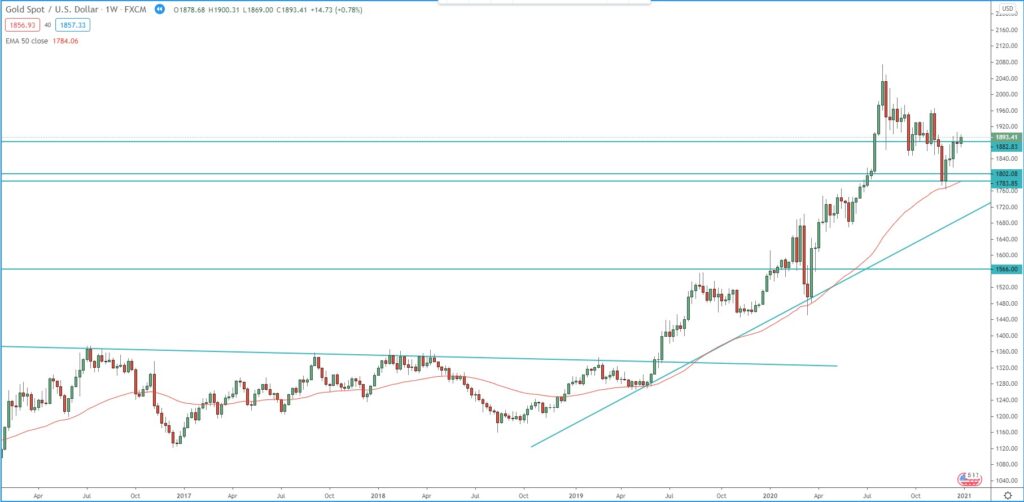
The weekly chart completed the 3rd bullish wave started after the break above 1370, the target of this break out was at 1.168 FIB extension around 2070 – 2080. Now the price is consolidating in anticipation of the beginning of the fifth bullish weekly wave.
Strong support to watch is around 1770, below that is the dynamic support, the ascending trend line.
Monthly chart:

Weekly chart:


