|
Getting your Trinity Audio player ready...
|
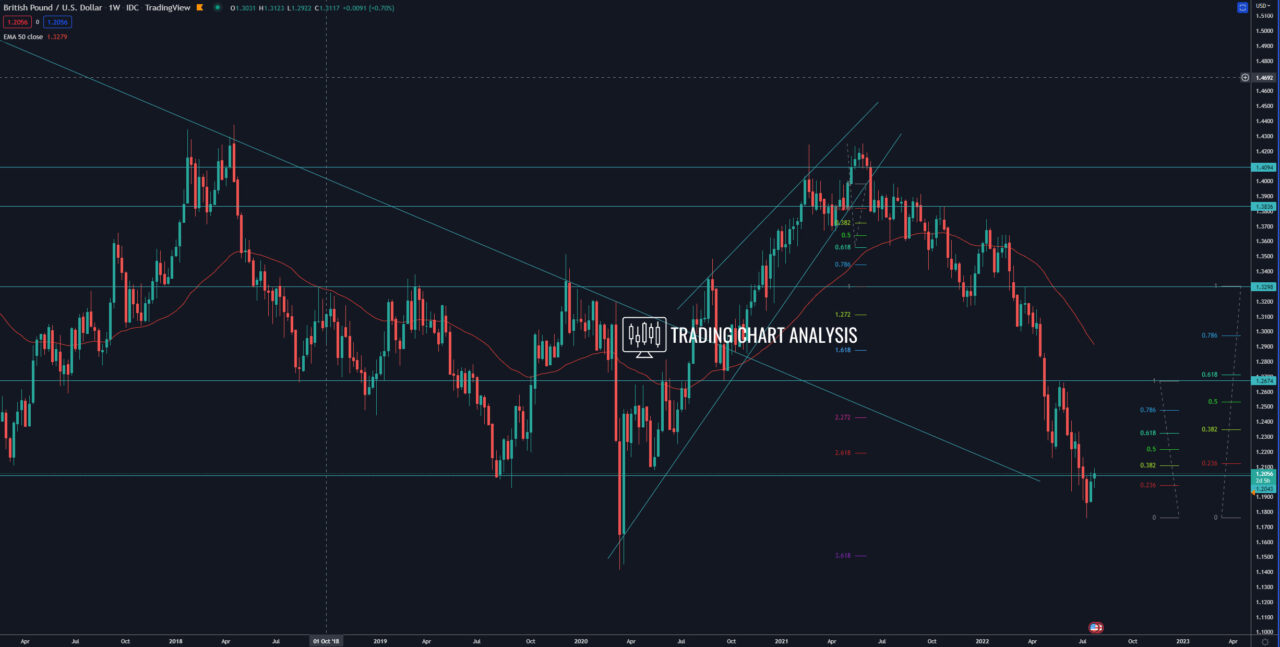
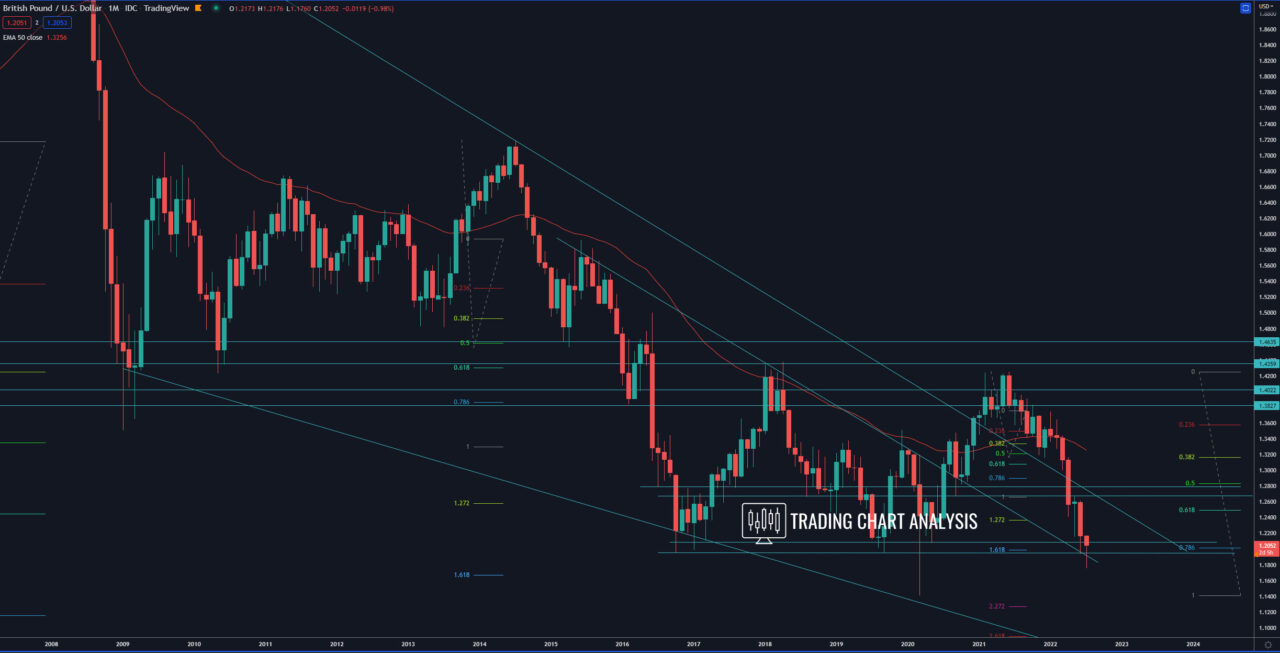
Technical analysis for GBP/USD, the price reached the second target for the bearish wave on the monthly chart, the 1.618 FIB extension around 1.1990-1.2000, and bounced from it, starting a pullback. The price went as low as 1.1760 and started a pullback on the daily and on weekly charts. On the four-hour chart, the GBP/USD formed a Head and shoulder pattern, confirming the pullback picture on the daily chart. The first target for this pullback is the 0.382 FIB retracement on the weekly chart at 1.2110. The second target is the 1.272 FIB extension on the four-hour chart at 1.2240. The third target is the 1.618 FIB extension on the four-hour chart at 1.2355, where we also have the 0.618 FIB retracement on the weekly chart. If the GBP/USD breaks above the resistance around 1.2355, that will open the door for a bullish run toward, first the 0.500 FIB retracement at 1.2540 and second toward the resistance at 1.2670.
On the other hand, if the GPB/USD breaks below the low at 1.1890, that will open the door for a retest of the previous low on the daily chart at 1.1760. And if the GBP/USD closes below 1.1760 on the weekly chart, that will clear the way for a bearish run toward the 2020 low at 1.1414.
Weekly chart:

Monthly chart:


