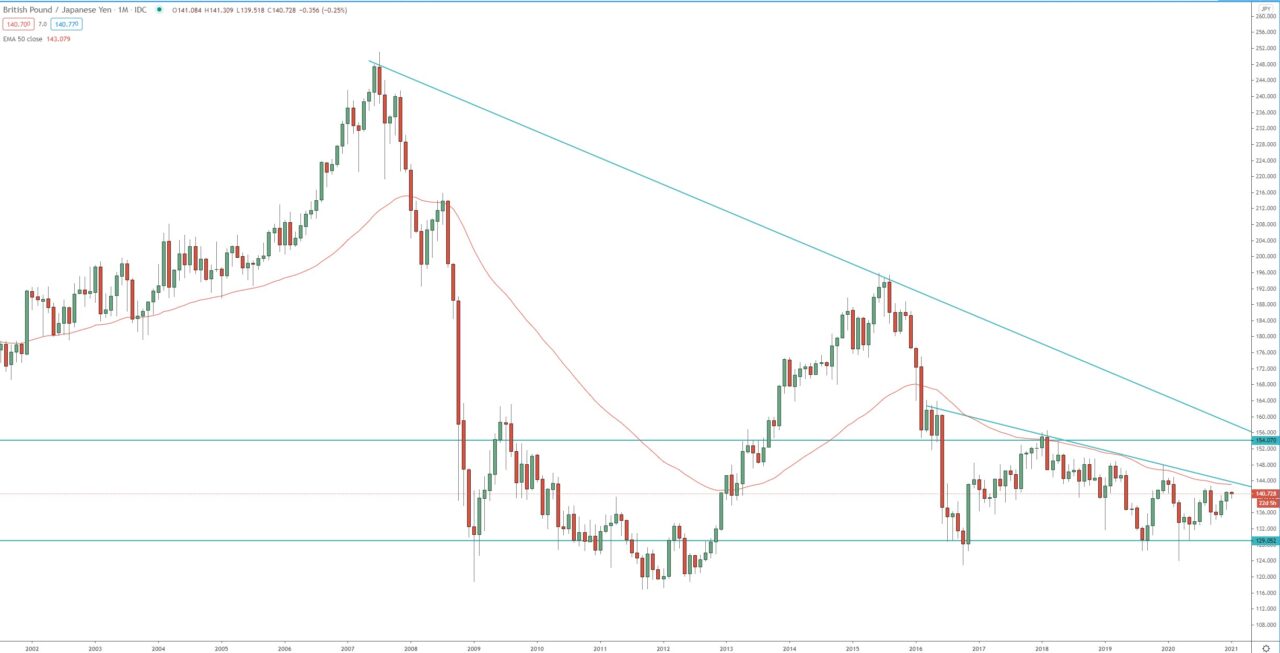
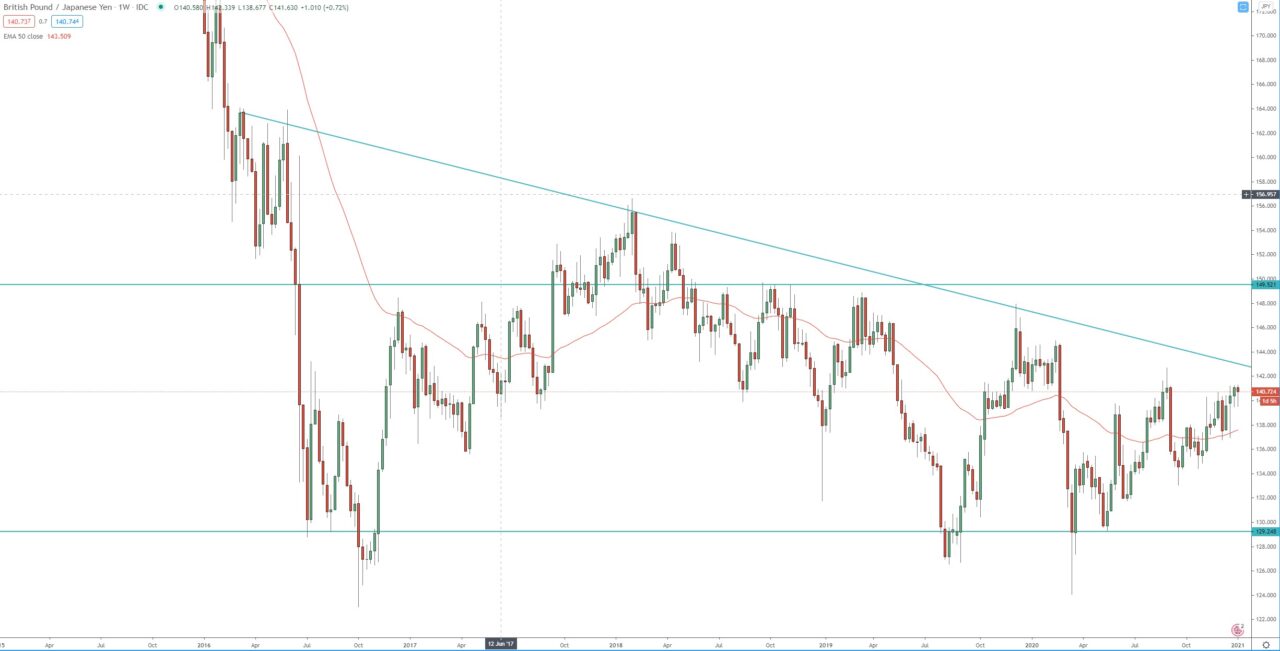
The pair formed double bottom on the monthly and weekly chart rejecting strong support around 127.00. If the price break above the descending triangle on the monthly and weekly charts, we should see rise toward 155.50 – 156.50 resistance.
The daily chart is within its 3rd bullish wave with, the first target of that wave is the 1.272 FIB extension around 144.00 and second target is 148.00.
The support between 139.00 – 140.00 should be monitor for rejection and resumption of the bullish trend.
Monthly chart:

Weekly chart:


