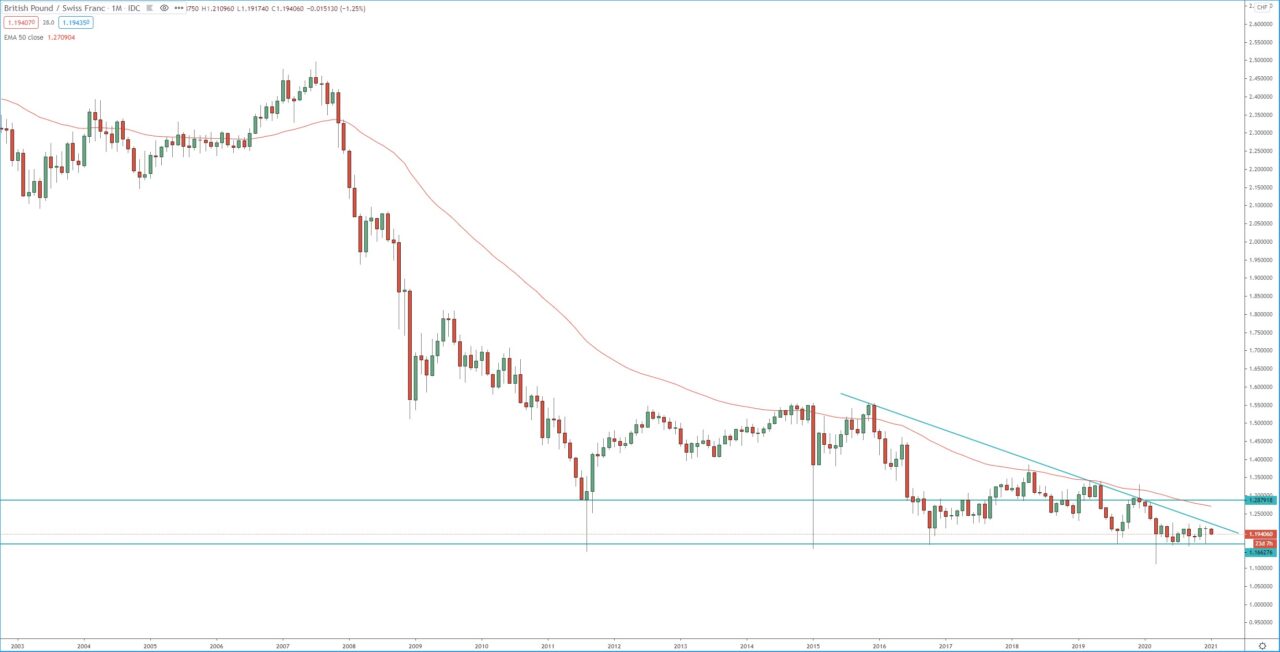
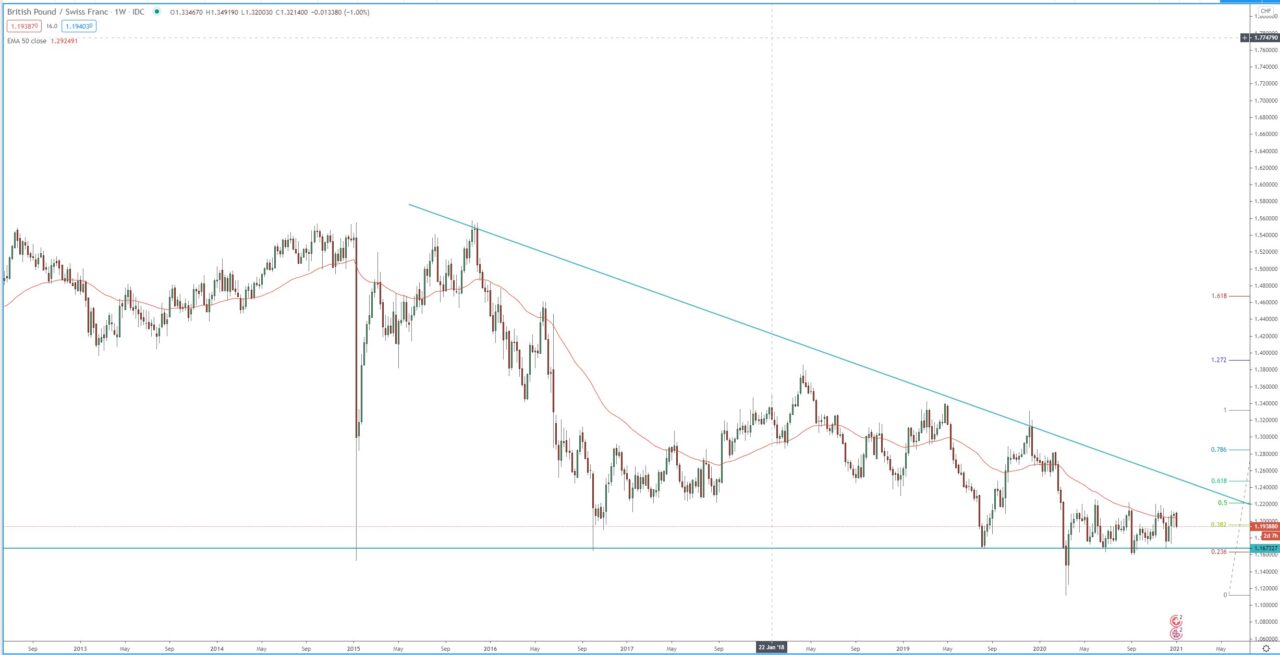
On the monthly chart the price held the 2011 low, despite the brief break below it on the daily and the weekly charts. While holding this support around 1.1470, the price formed descending triangle on both the monthly ad the weekly charts. Break above that triangle will start a new bullish run. Therefore, we need to watch for early signs about that and looking at the range that has been forming on the monthly and the weekly charts since March 2020. We may get that early sign if the price break that range between 1.1600 – 1.2250 to above on the weekly chart. If indeed we witness a break out of that consolidation to the upside, that break may lead to break out of the descending triangle and start a new bullish trend.
Break above 1.2250 on the weekly chart will lead to rise in the price toward, first around 1.3050 and then toward 1.3450.
Monthly chart:

Weekly chart:


