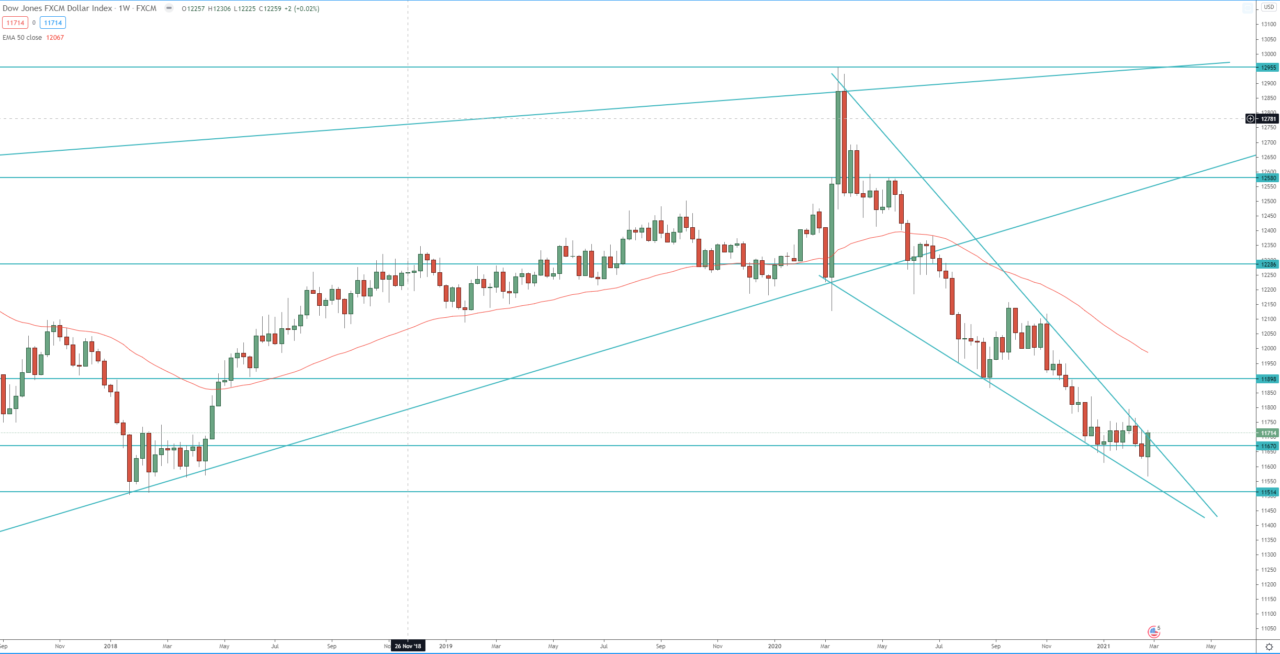
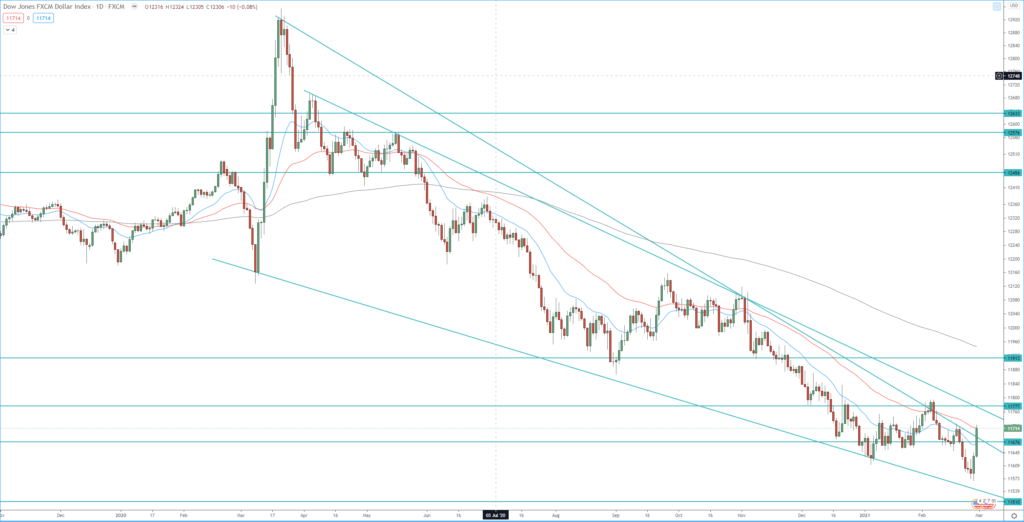
Despite the strong bullish momentum from the last week and the closing with a bullish engulfing candle on the weekly chart, the price reached resistance, and we need further price action to draw any conclusion for the next move. The index is sitting at the previous daily high at 11 728, and the daily 50 EMA and descending trend line on the weekly and the daily charts that is a strong resistance zone. Therefore, if we see breaks above that resistance zone, breaks above 11 728, that will be a signal for further ascending toward 11 795.
On the other hand, if the price break below the previous low at 11 567, it will resume the bearish trend and send the index toward, first 11 506, and the second toward 11 400, the first target of the 3rd weekly bearish wave.
Weekly chart:

Daily chart:


