|
Getting your Trinity Audio player ready...
|
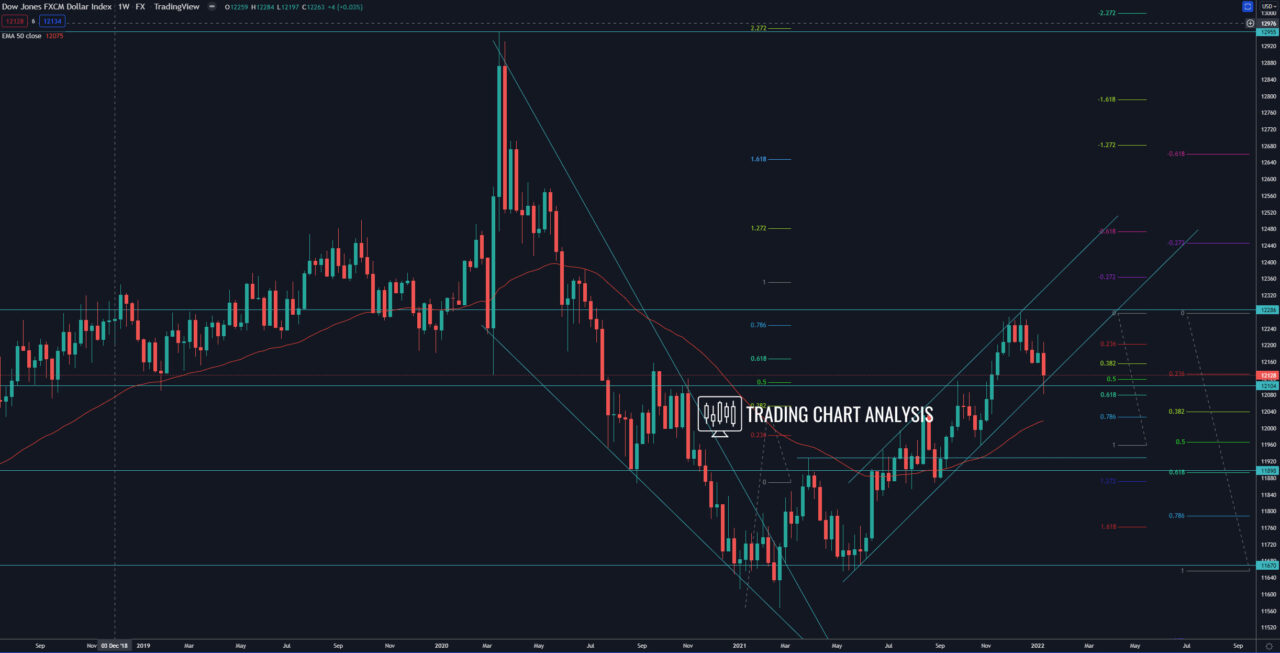
Technical analysis for the FXCM dollar index, the index reached the 0.618 FIB retracement and horizontal and dynamic support on the weekly chart. If the index breaks below the ascending channel on the weekly chart and below the low at 12082, that will be a signal for further declines. The first target for the potential breakdown is the low on the weekly chart at 11 959. The second target for the bears of the FXCM dollar index is the support and the 0.618 FIB retracement at 11 895.
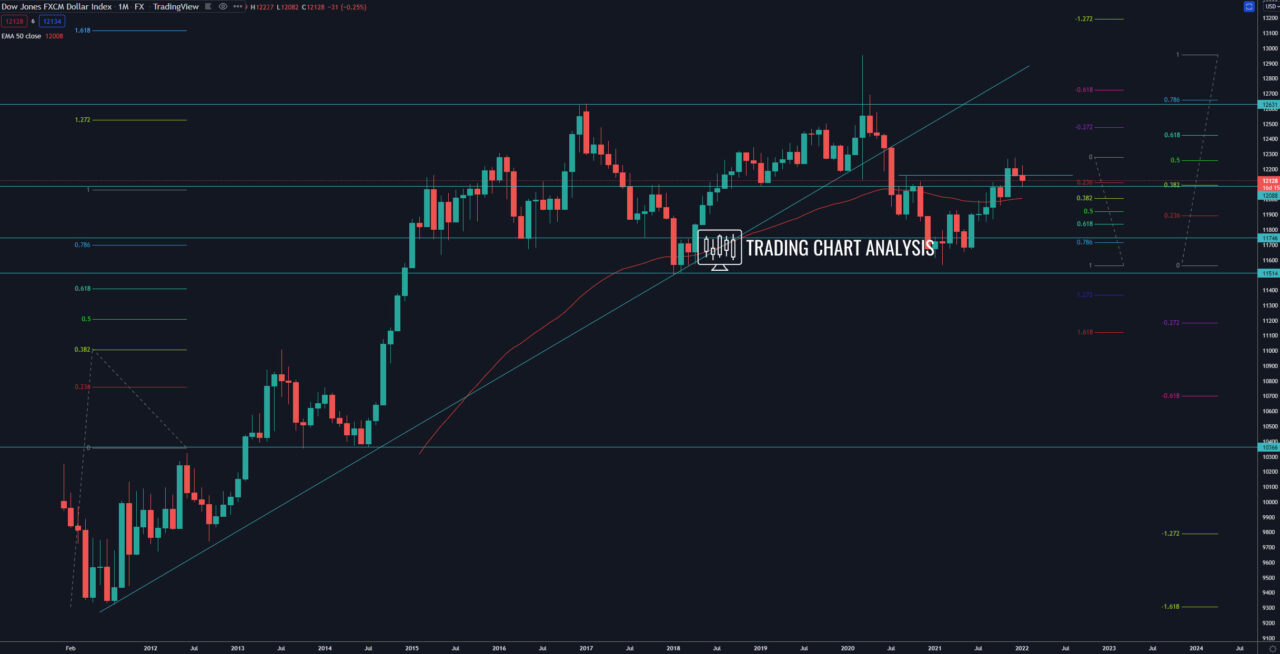
On the monthly chart, the FXCM dollar index broke above the 0.382 FIB retracement and the high at 12 158. This breakout opens the door for a bullish run toward the 0.618 FIB retracement on the monthly chart at 12 425. Therefore, if the price break above the daily high at 12 227, that will be an early signal for resumption of the bullish trend.
Weekly chart:

Monthly chart:


