|
Getting your Trinity Audio player ready...
|
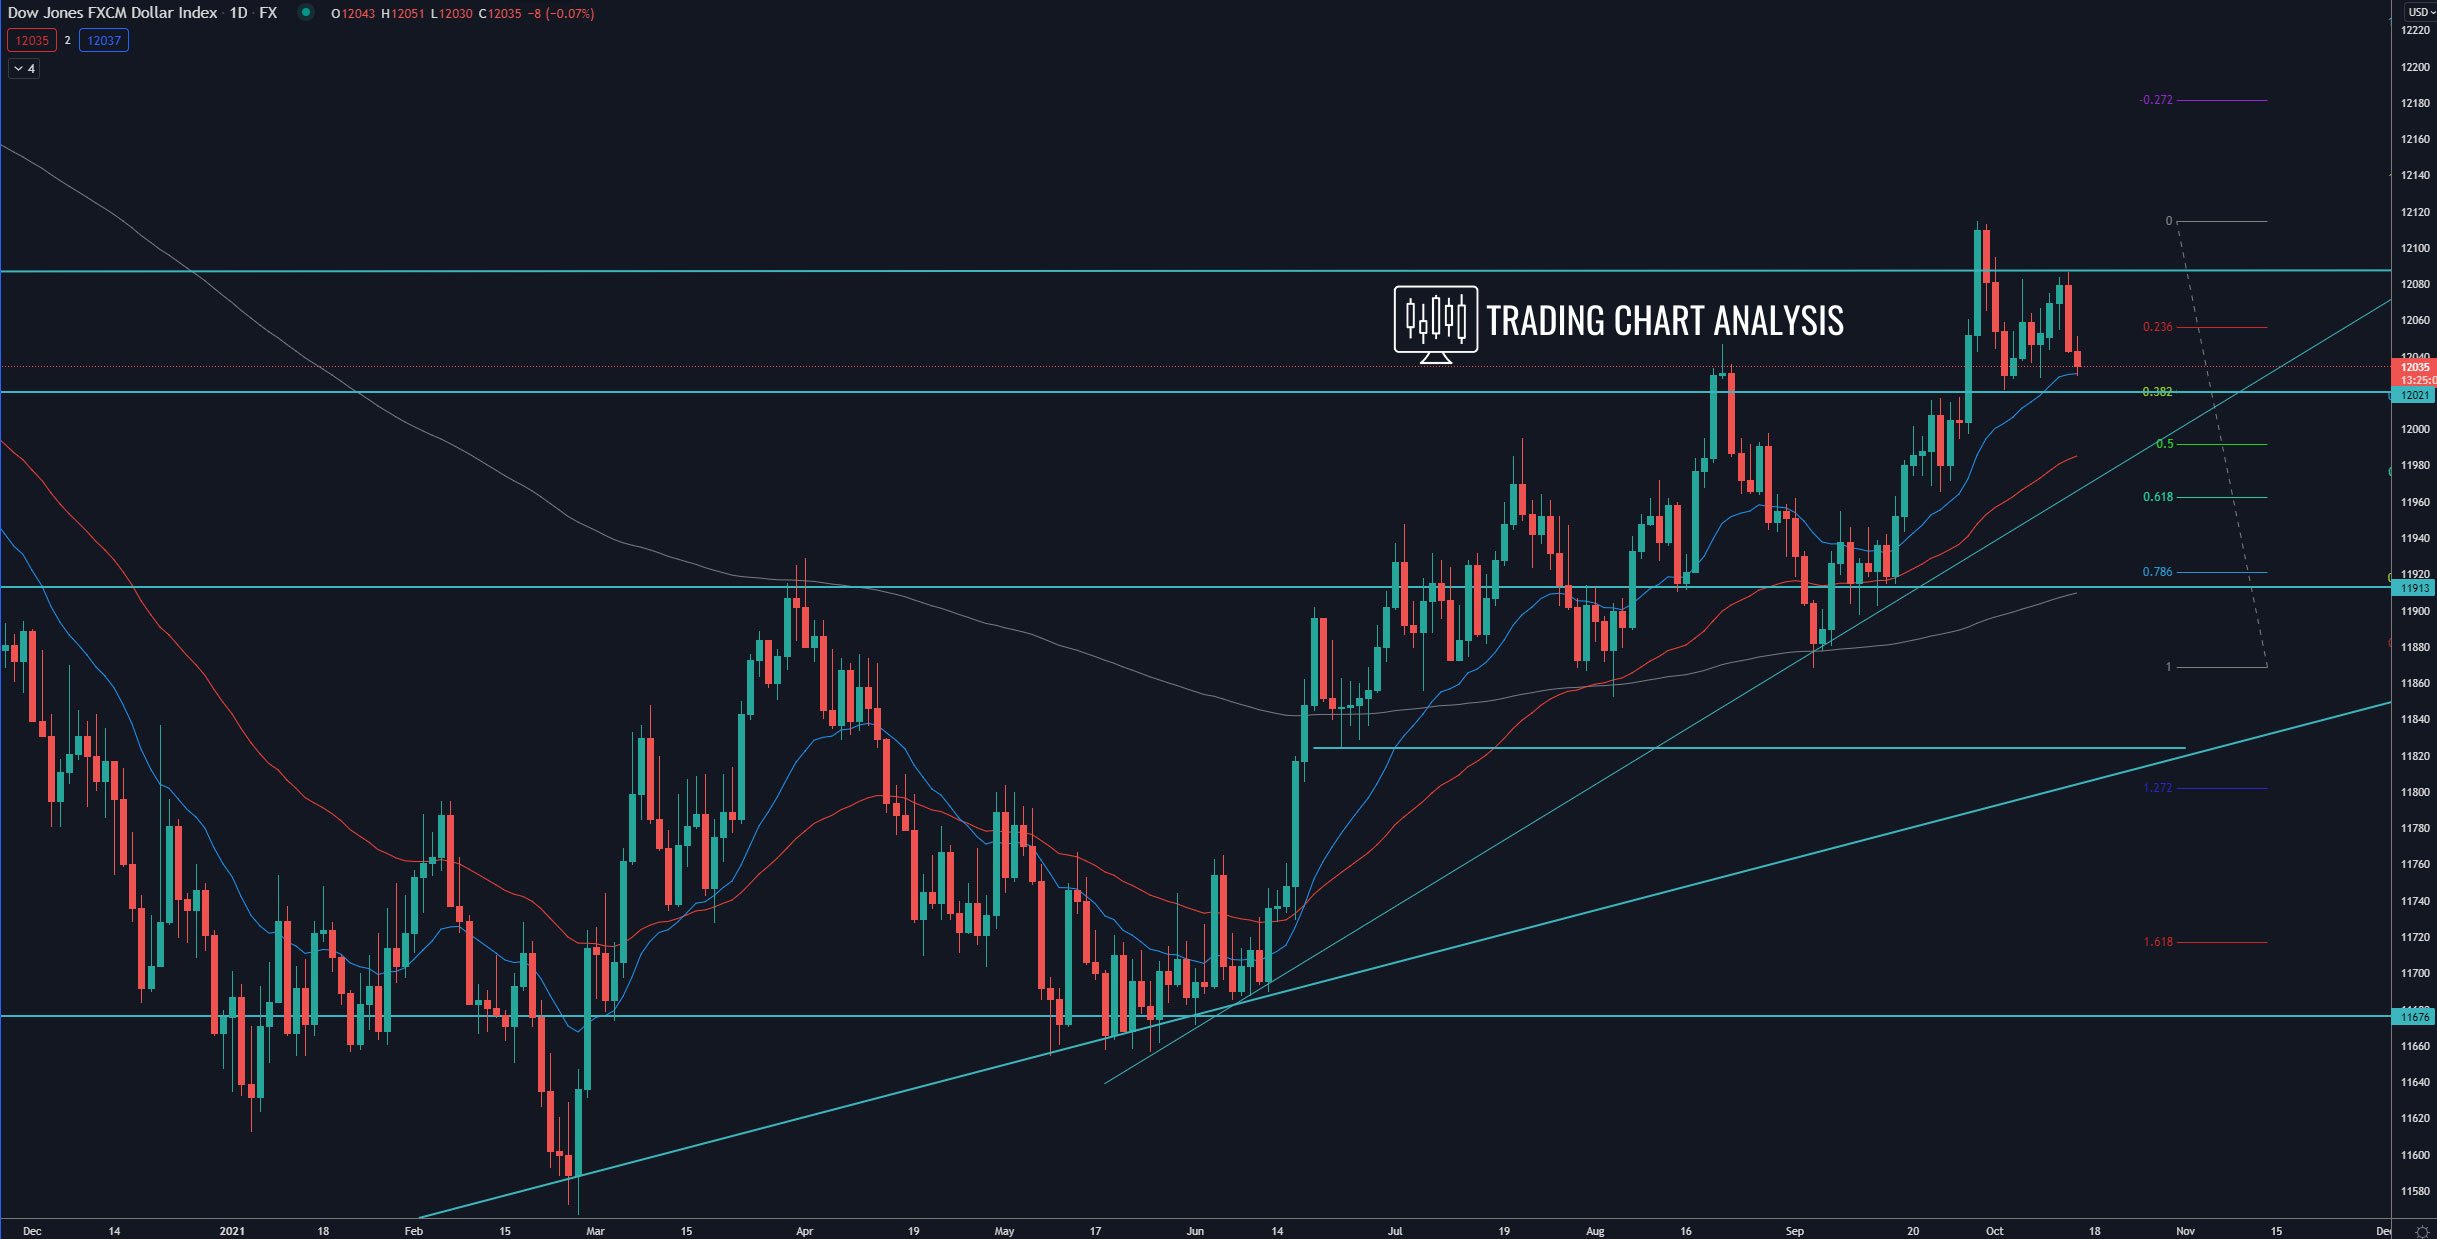
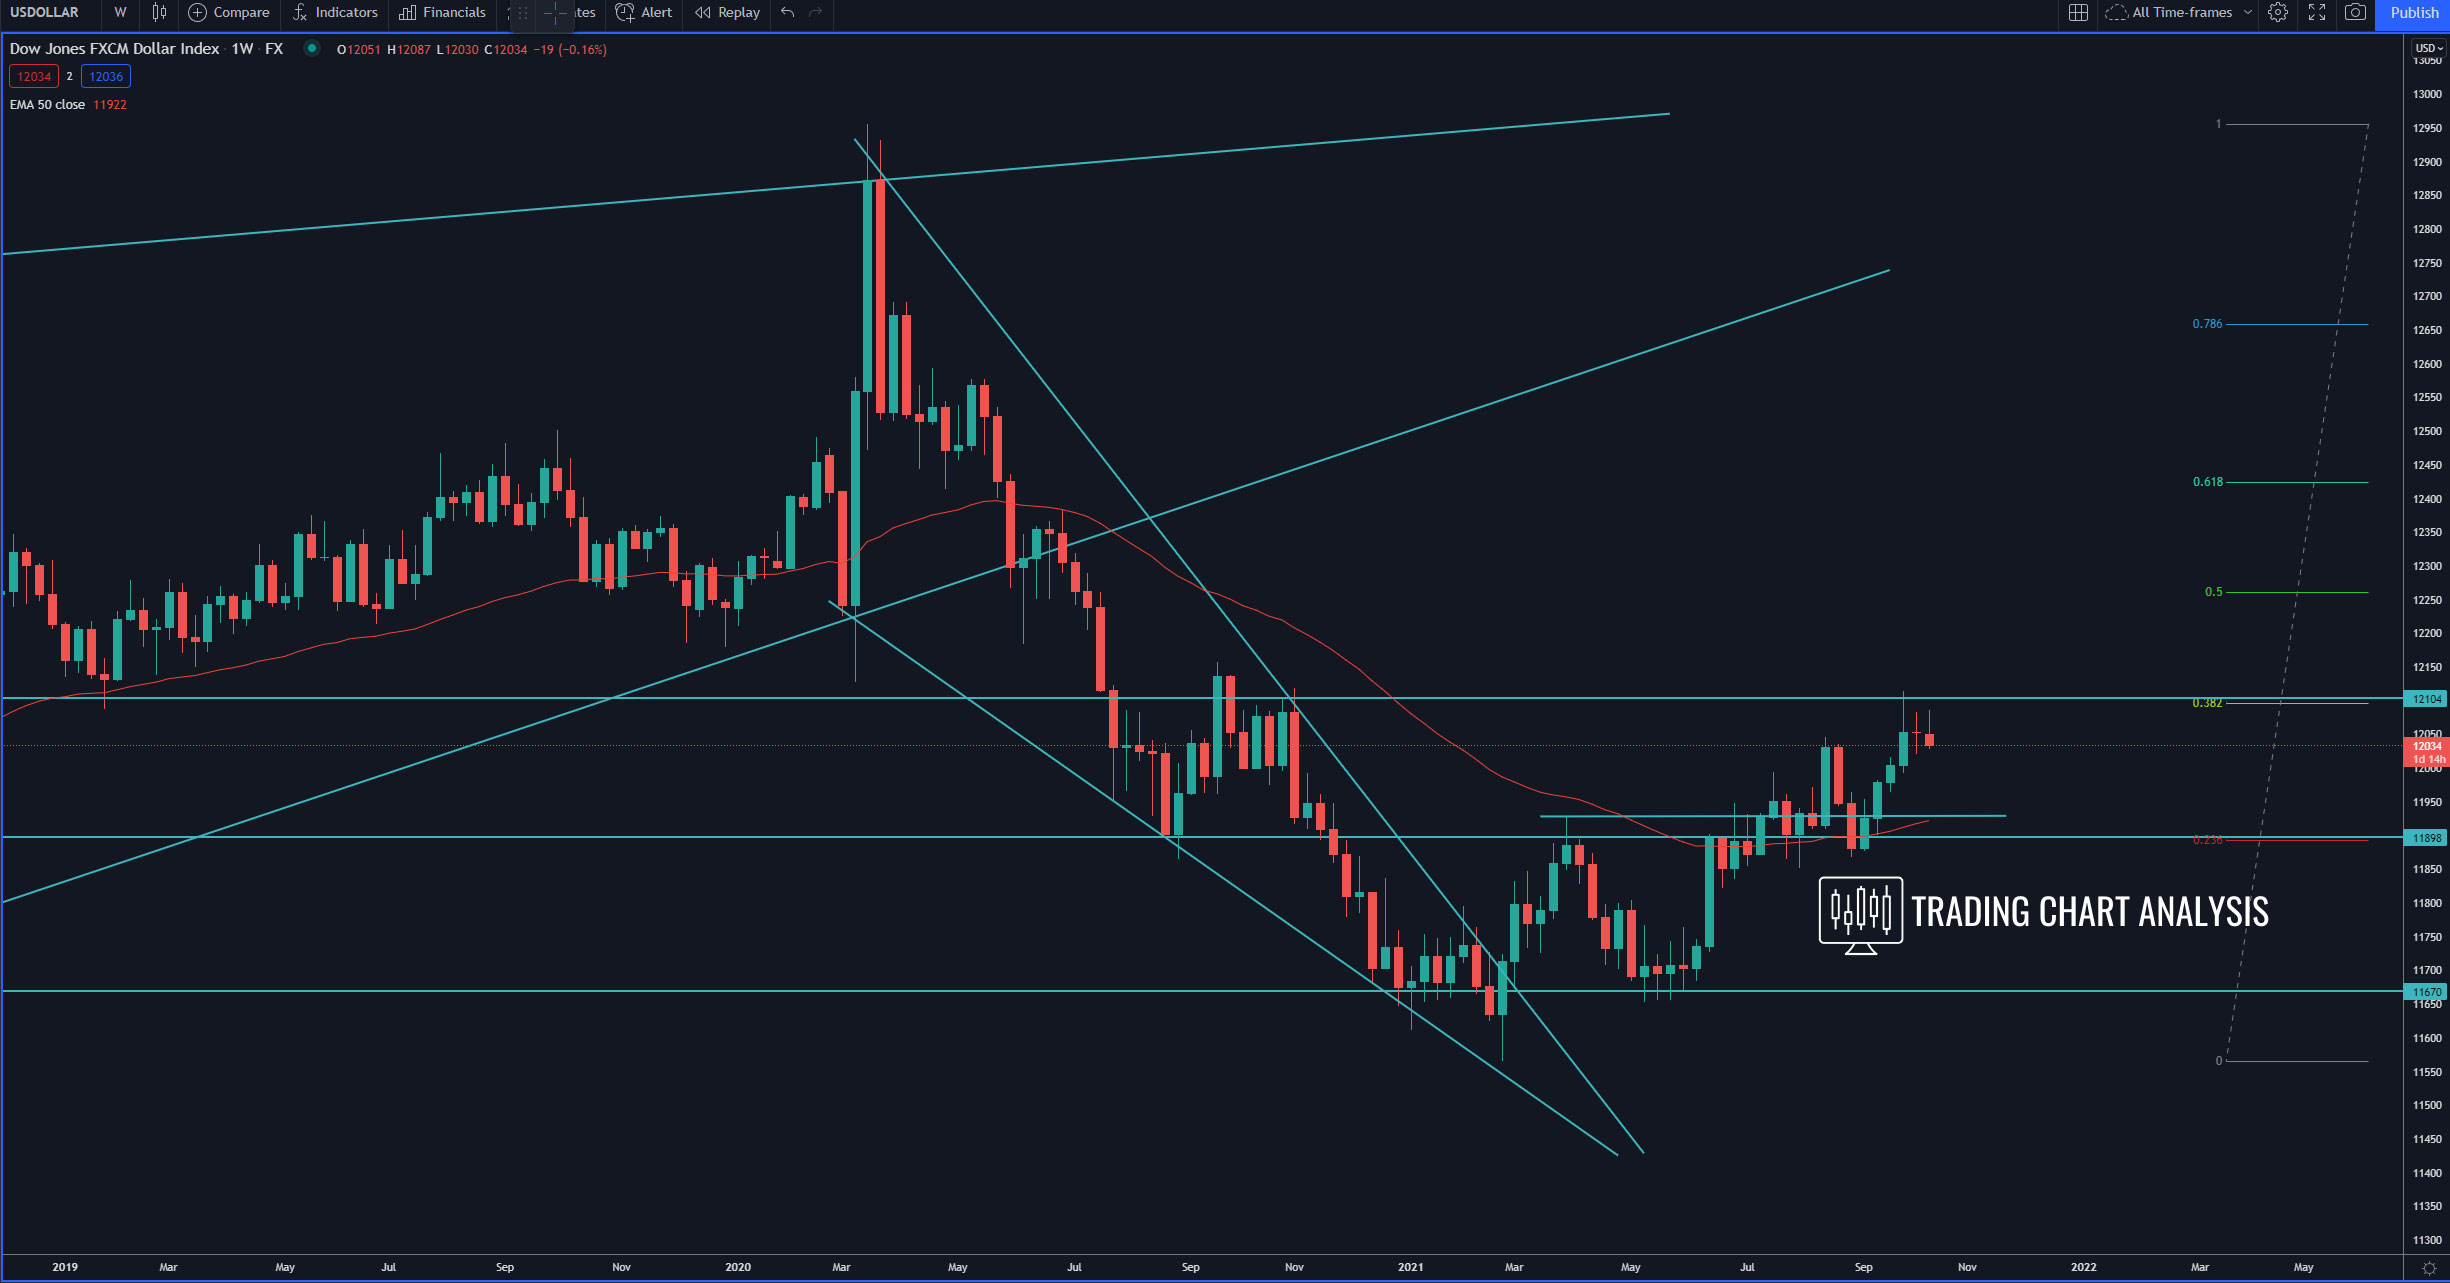
Technical analysis for the FXCM dollar index, the price reached a key resistance and the 0.386 FIB retracement on the weekly and the monthly charts and started a pullback on the daily chart. The focus now is on the previous daily low at 12 022, which is a 0.386 FIB retracement. If the FXCM dollar index breaks below the 0.386 FIB retracement at 12 022, that will be a signal for further bearish pressure toward the 0.618 FIB retracement and the low at 11 966.
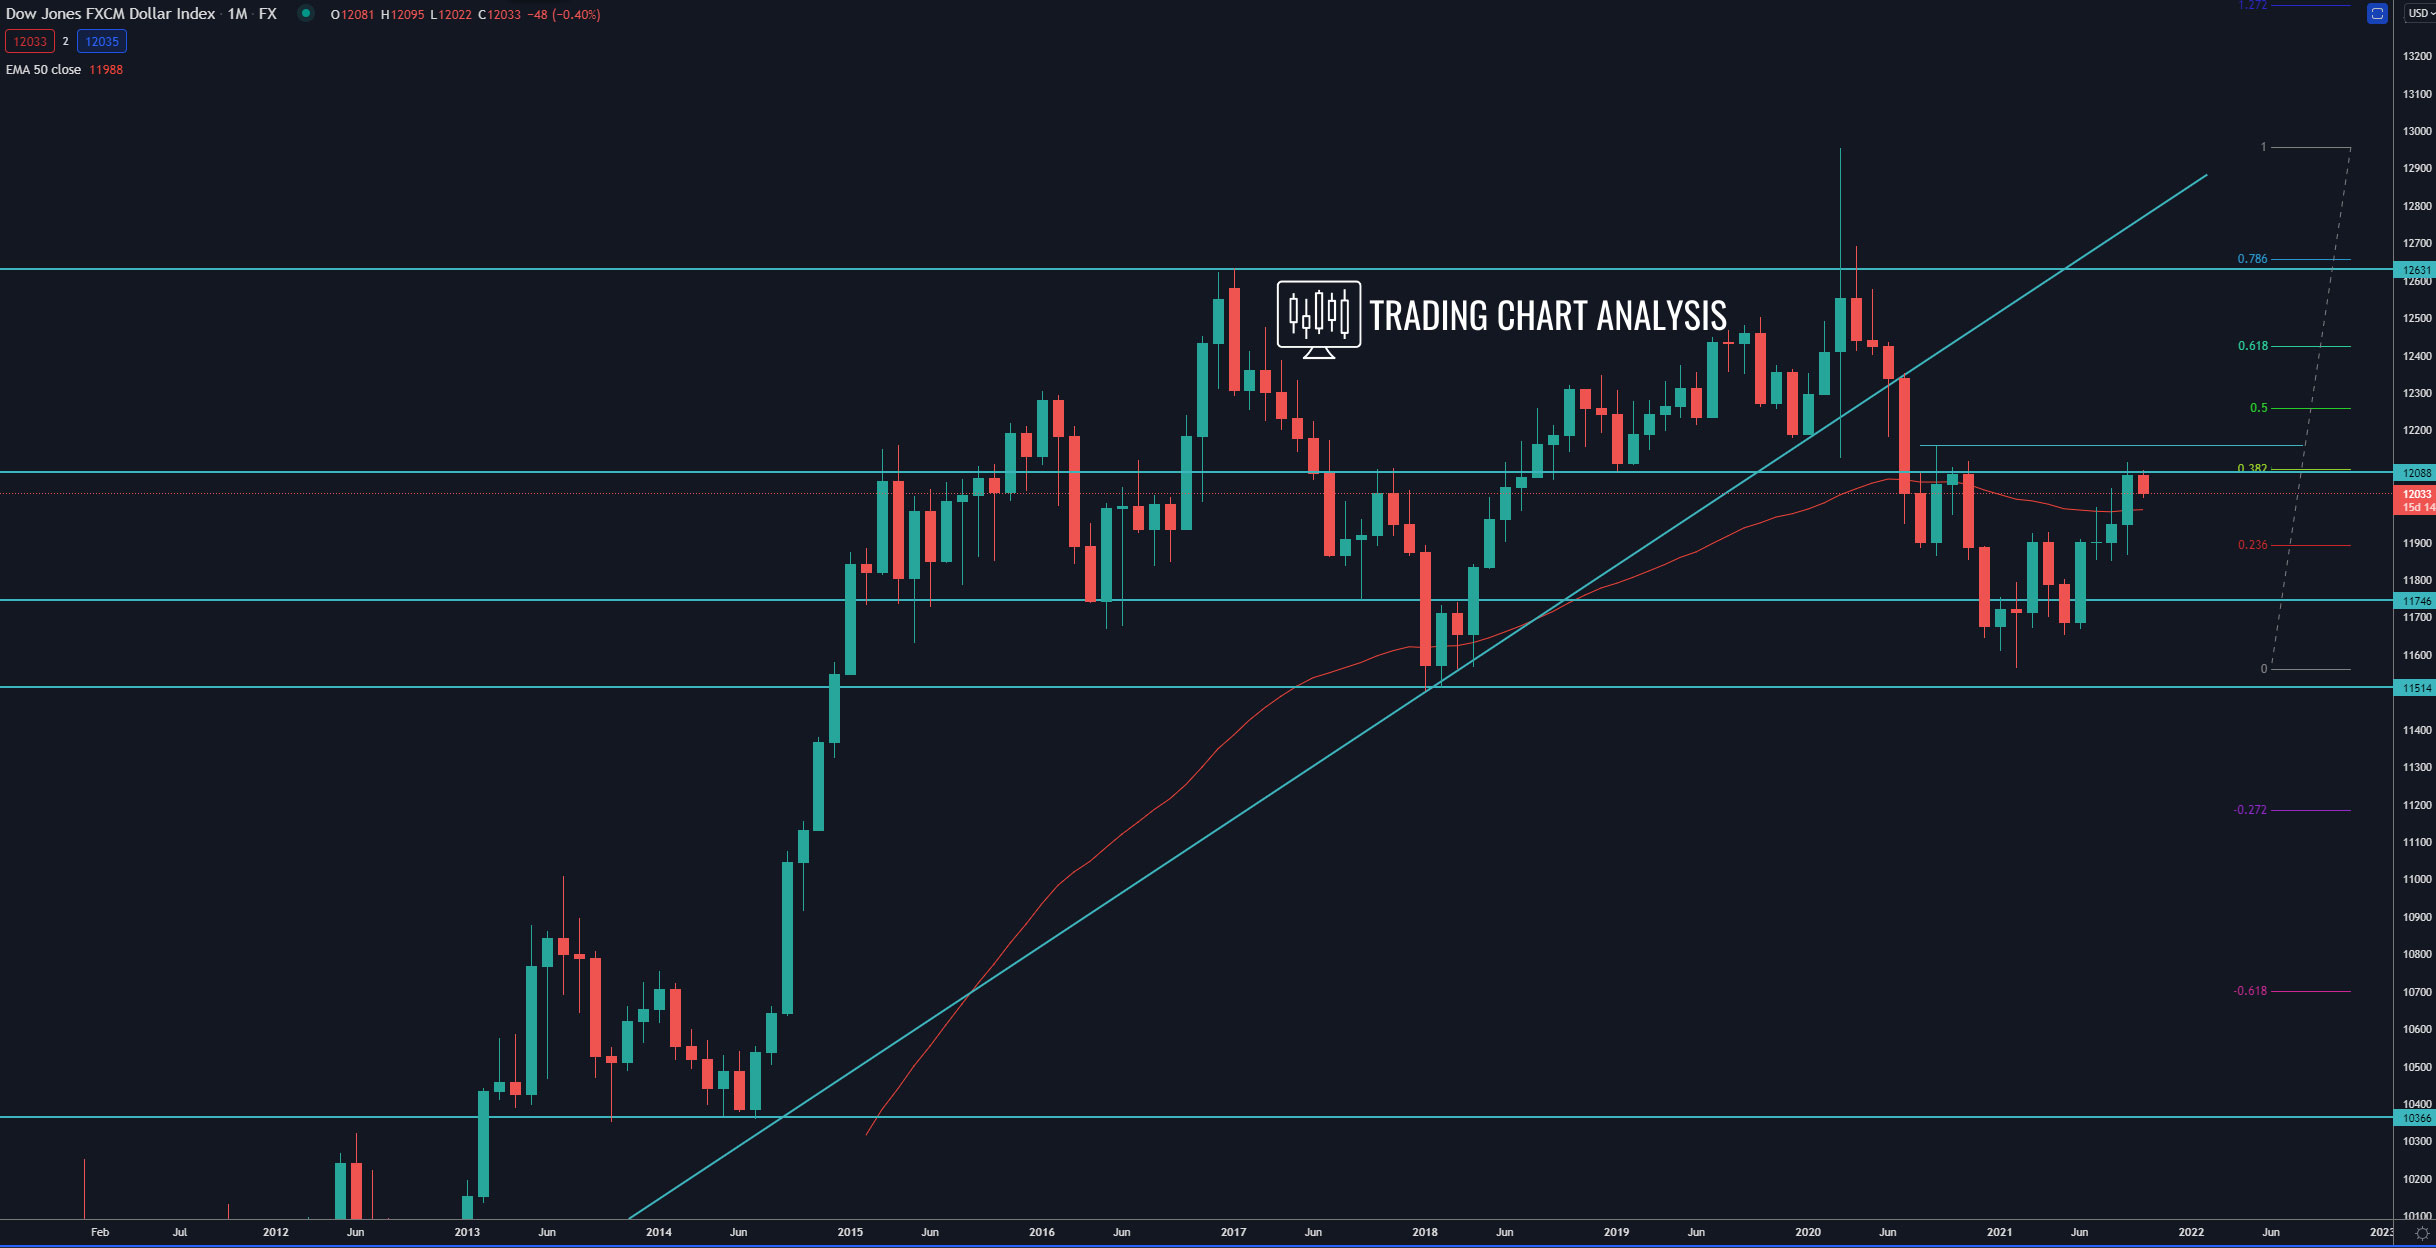
The previous monthly high at 12 158 is a key level for the FXCM dollar index. If the index breaks above 12 158, that will have bullish implications, and it will open the door for a bullish run toward the 0.618 FIB retracement on the monthly chart at 12 425.
Daily chart:
Weekly chart:
Monthly chart: