|
Getting your Trinity Audio player ready...
|
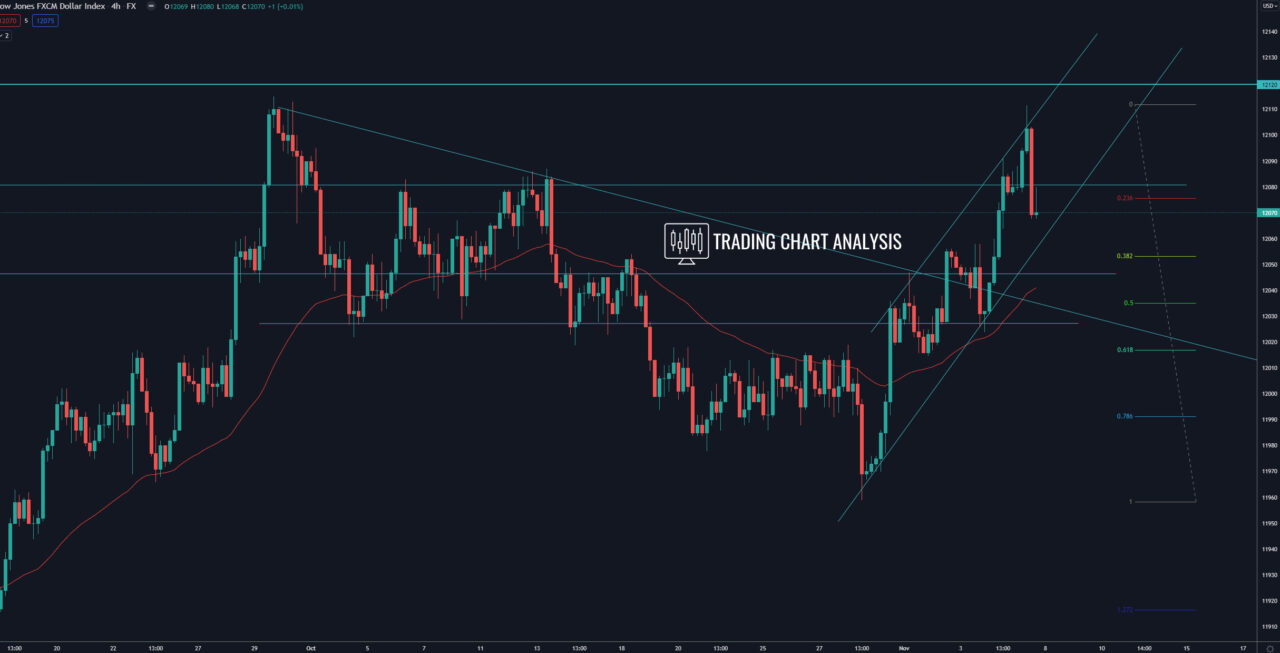
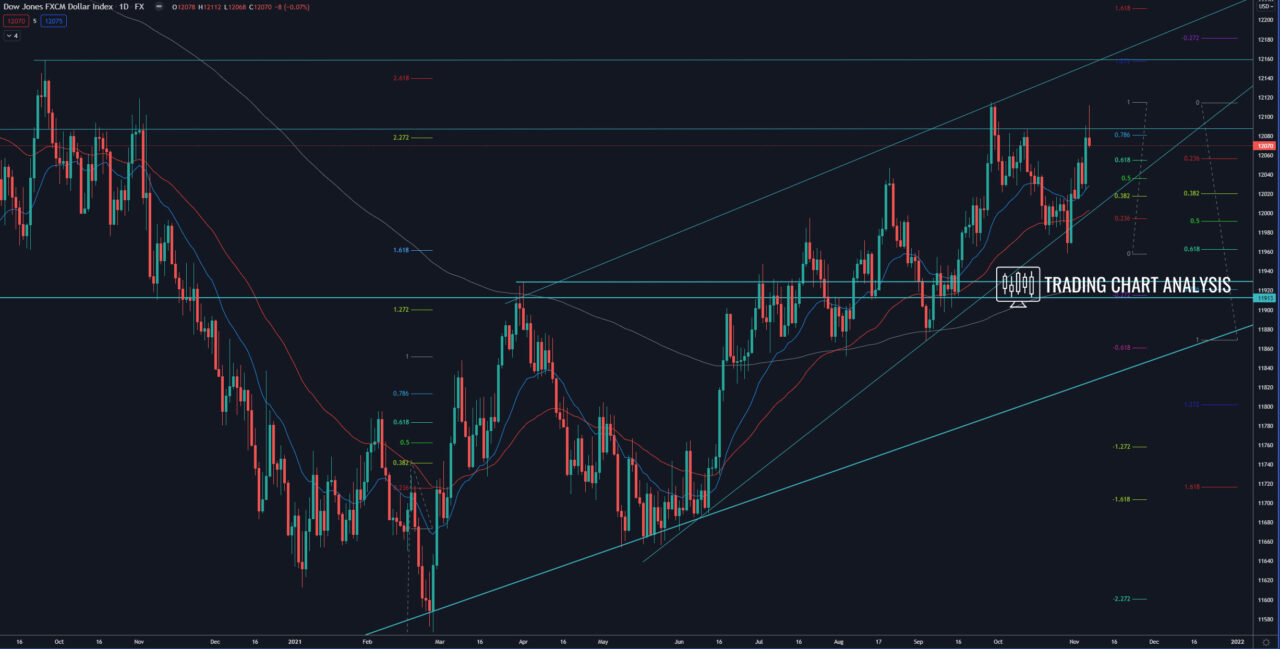
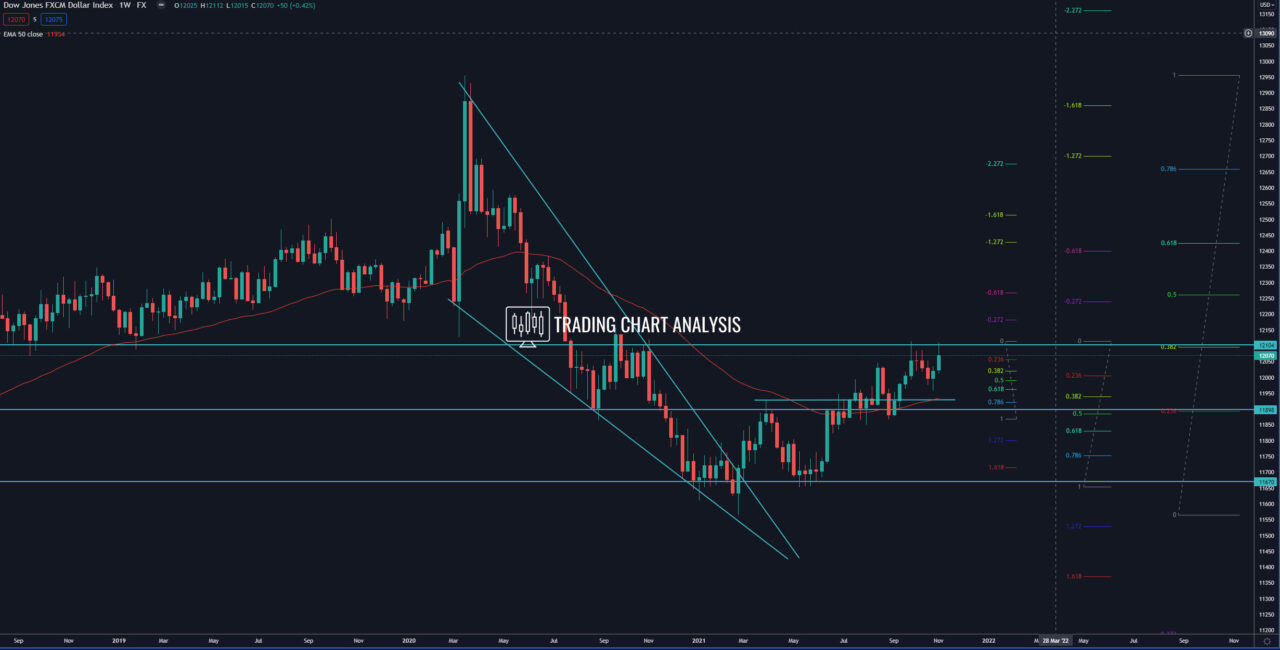
Technical analysis of the FXCM dollar index, the index closed with a high-test candle on the daily chart, forming a double top, an early signal for a potential decline ahead. Also, the index is within a key resistance zone between the 0.386 FIB retracement at 12 095 and the high from September 2020 at 12 159. The focus now is on the ascending price channel/flag on the four-hour chart. A break below the channel and the 0.386 FIB retracement at 12 050 will open the door for further declines toward the support zone between 12 024 and the 0.618 FIB retracement at 12 015. Furthermore, a break below 12 015, will send the index lower toward the weekly 50 EMA and support zone between 11 930 – 11 870.
On the other hand, if the FXCM dollar index, break above the high at 12 115, it will open the door for a run toward the September 2020 high at 12 159. If the index breakout above 12 159, it will have further bullish implications, and it will send the index higher toward the 0.618 FIB retracement at 12 425.
4H chart:

Daily chart:

Weekly chart:


