|
Getting your Trinity Audio player ready...
|
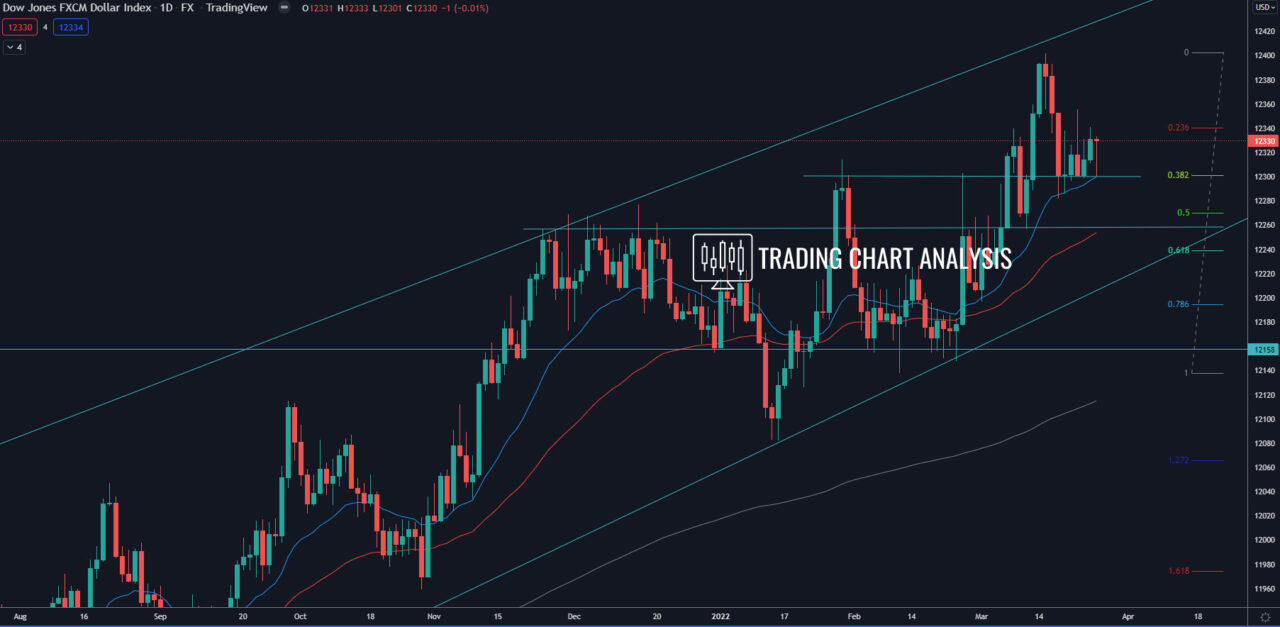
Technical analysis for the FXCM dollar index, the index is holding the support and 0.382 FIB retracement on the daily chart around 12 300. If the dollar index breaks below the low at 12 282, it will open the door for a bearish run toward the 0.618 FIB retracement on the daily chart and the 0.382 FIB retracement on the weekly chart, at 12 235.
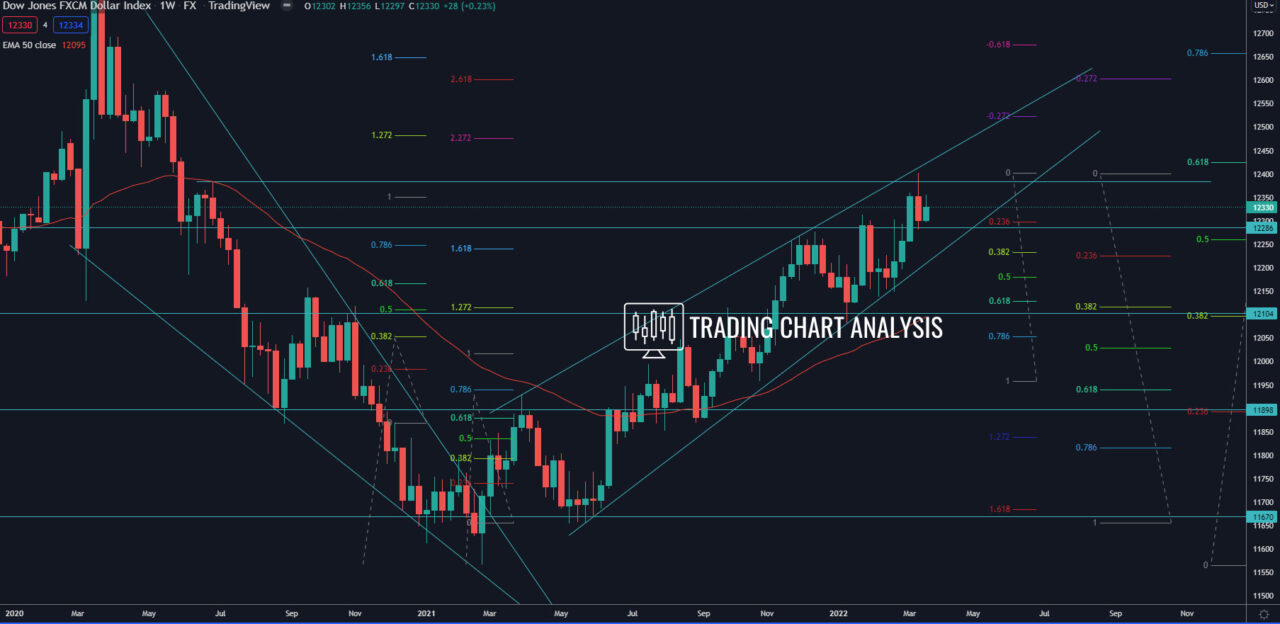
Looking at the bigger picture, the FXCM dollar index has respected the high and resistance zone around 12 383, a break above it will send the index higher toward the 0.618 FIB retracement at 12 425. And a break above 12 425 will open the door for a bullish run toward the 1.272 FIB or 2.272 FIB extensions (depending on how you count the wave) on the weekly chart around 12 485. The second target for the bullish wave on the weekly chart for the FXCM dollar index is the 1.618 FIB extension or 2.618 FIB extension between 12 600 – 12 650.
Daily chart:

Weekly chart:


