Technical analysis for 7-13 February 2021
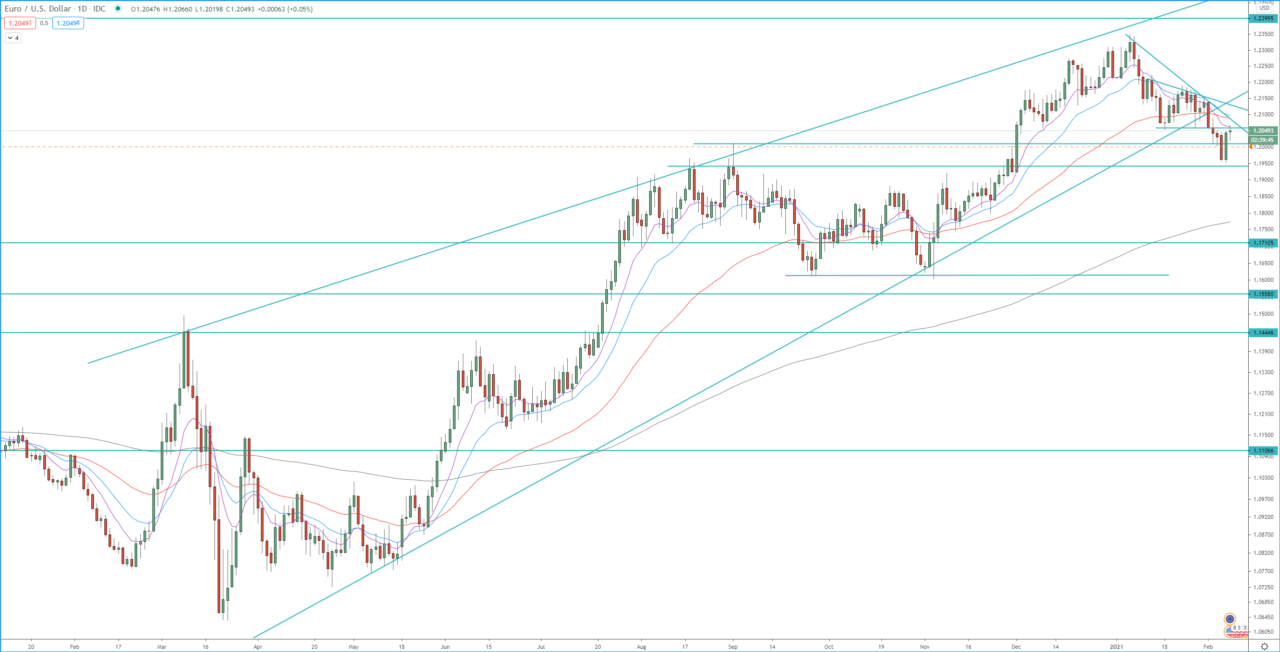
Last week we witnessed a breakdown, the price broke below the key support at 1.2055, below the pennant pattern, and below ascending wedge on the daily chart. This breaks down extended the 3rd wave of the 4H bearish run, the first target of that wave is at 1,272 FIB extension around 1,1940-1,1950 and it was already reached, the second target is at 1.618 FIB extension around 1.1865, and the 0.618 FIB retracement. This bearish wave will be invalidated if the price break above 1.2180.
Resistances to watch are at 1.2055, 1.2090, and between 1.2130 – 1.2150, we have a strong resistance as well.
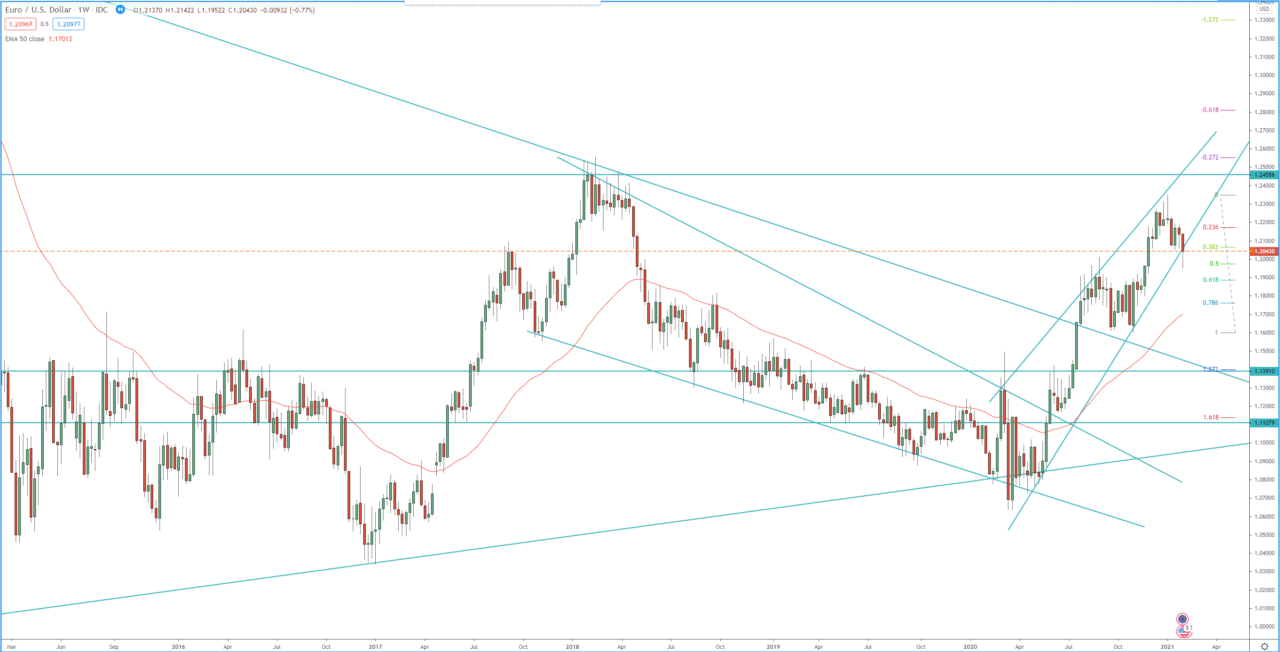
We must point out that on the weekly chart the break of the ascending wedge is not a break yet, we need to see the price closing firmly below the wedge, which is not the case at the moment.
Weekly chart:

Daily chart:


