|
Getting your Trinity Audio player ready...
|
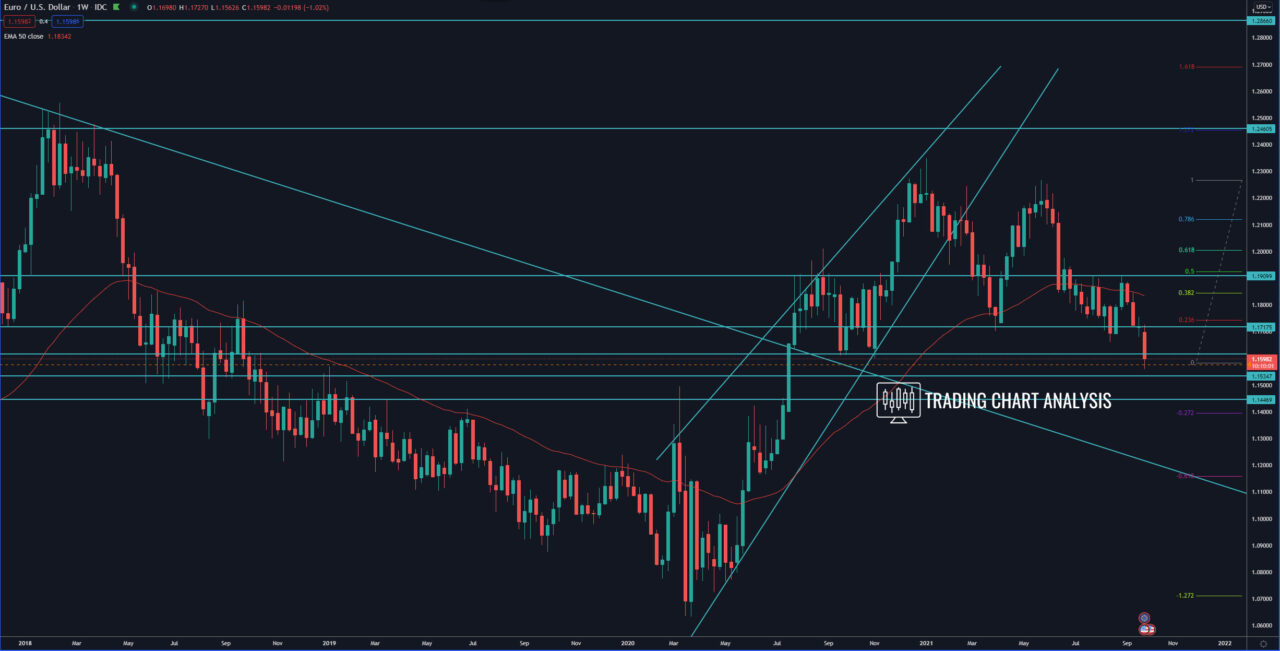
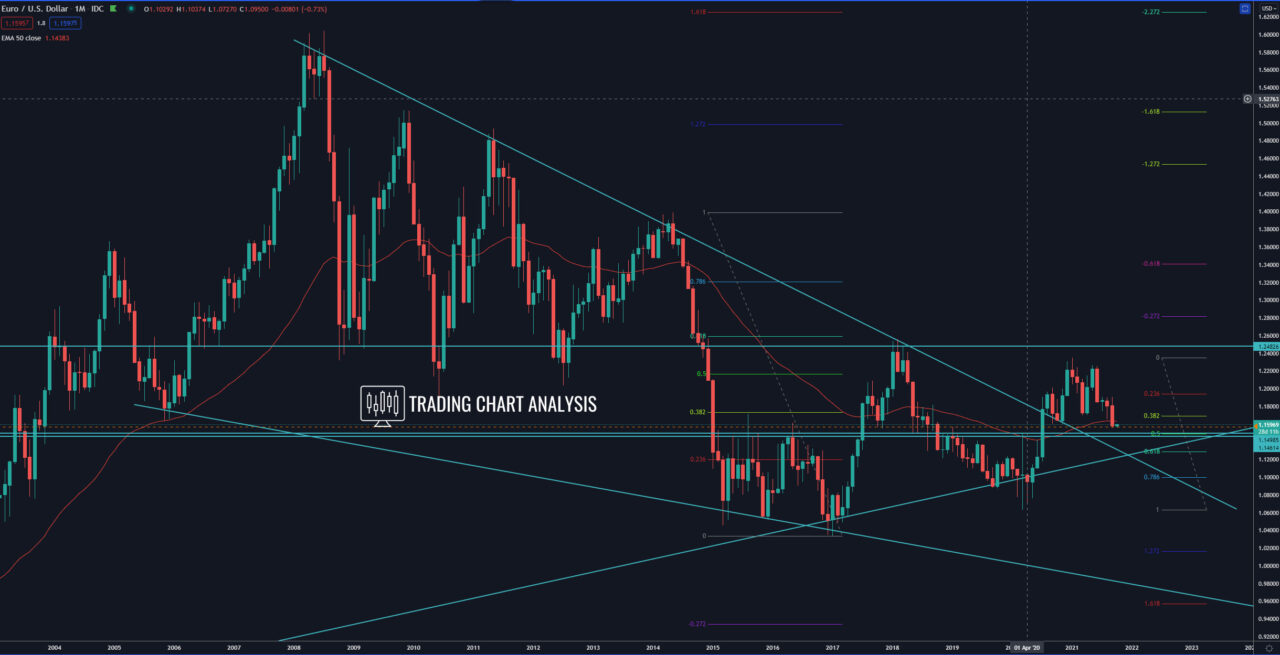
The EUR/USD pair broke below the key support at 1.1600, which was a double bottom on the weekly and the daily charts. Not only that, but on the monthly chart, the pair also broke below the 0.386 FIB retracement at around 1.1695 – 1.1700. Both of these events are tilting the long-term view to the bearish side. The first target of the bearish breakout is the 1.272 FIB extension on the weekly chart at 1.1450. The second target is the 0.618 FIB retracement on the monthly chart at 1.1285. The third target is the 1.618 FIB extension on the weekly chart at 1.1225.
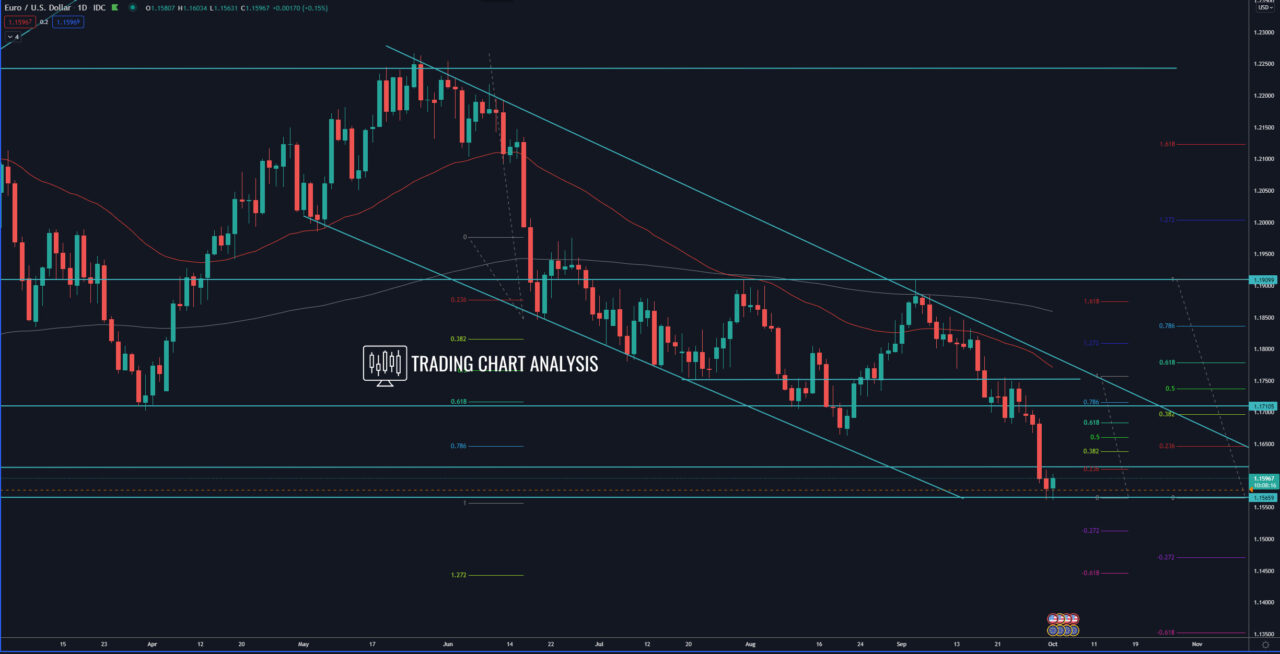
Looking at the daily chart, we can see that the EUR/USD pair is oversold and already reached the support zone between 1.1550 – 1.1565, which is 100 FIB extensions on the daily chart and 2.618 FIB extension on the four-hour chart. Therefore a potential pullback is to be expected.
The resistance zone between 1.1880-1.1910 is now a key resistance for the EUR/USD, which the traders and the institutional investors will watch for selling opportunities.
We must note that both the DXY and the FXCM dollar indexes are sitting at a key resistance and 0.386 FIB retracement, we must see a break to the upside to confirm further strength in the USD.
Daily chart:

Weekly chart:

Monthly chart:


