|
Getting your Trinity Audio player ready...
|
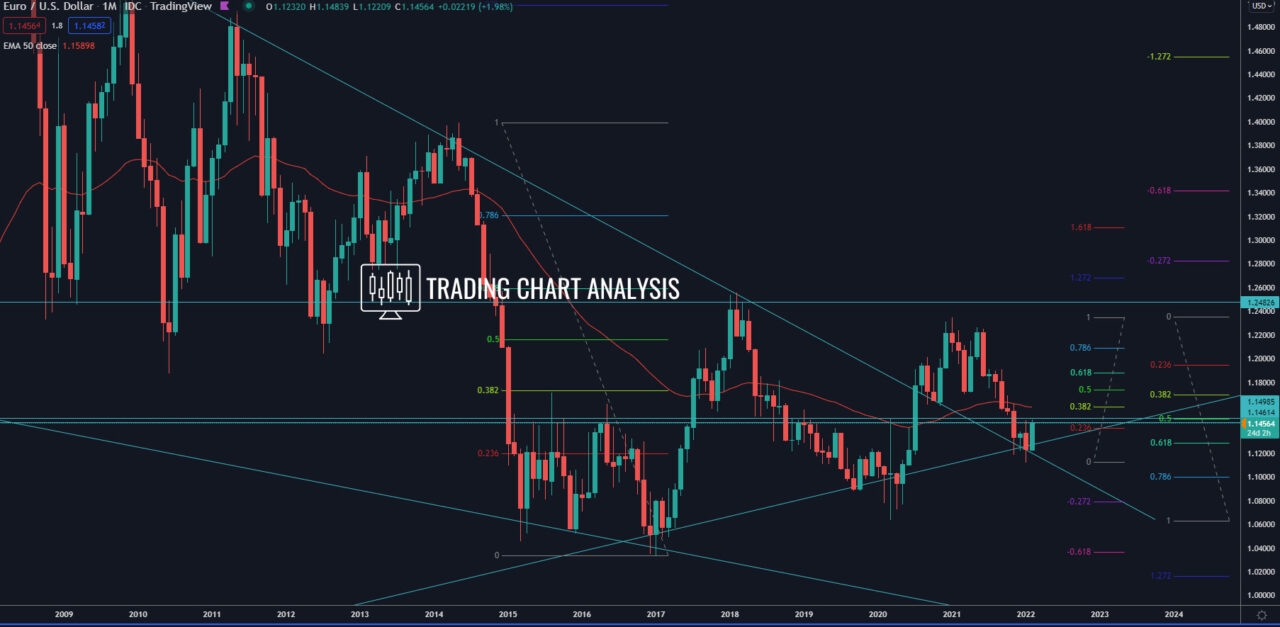
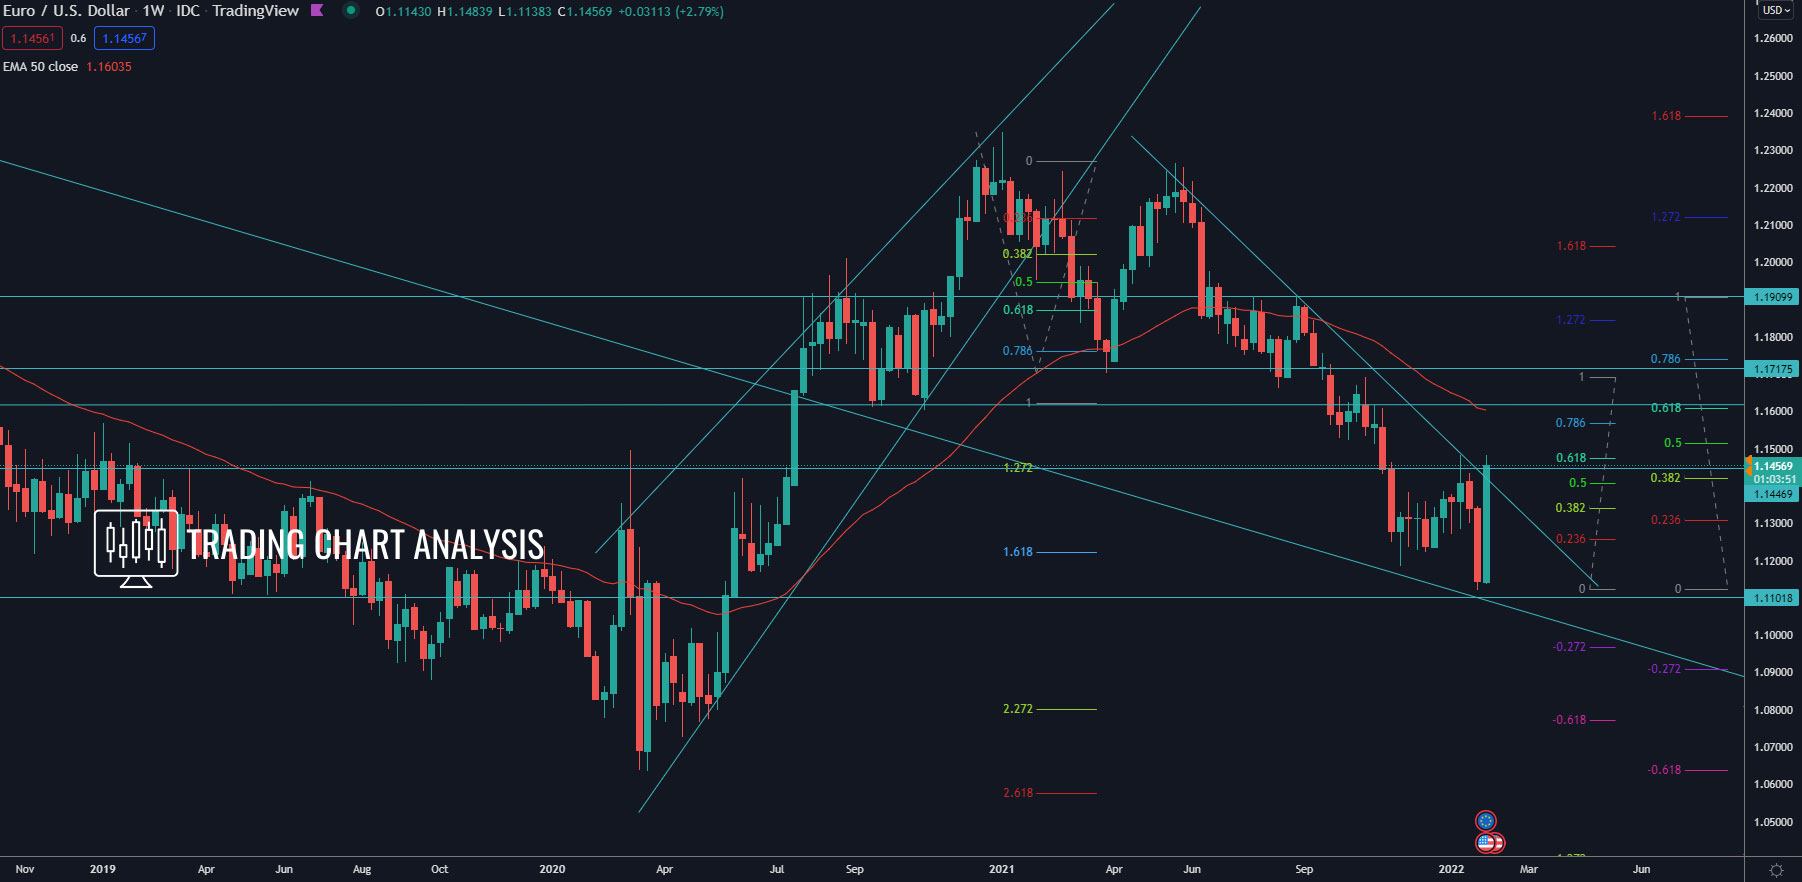
Technical analysis for the EUR/USD, the pair closed the week with a bullish engulfing candle on the weekly chart, signaling a potential breakout. The EUR/USD reached the previous daily high at 1.1481 and bounced from it. However, a breakout to the upside looks imminent for the EUR/USD. The first target for such a bullish breakout is the 0.382 FIB retracement on the monthly chart at 1.1595. On the weekly chart, the 0.618 FIB retracement is at 1.1605-1.1610.
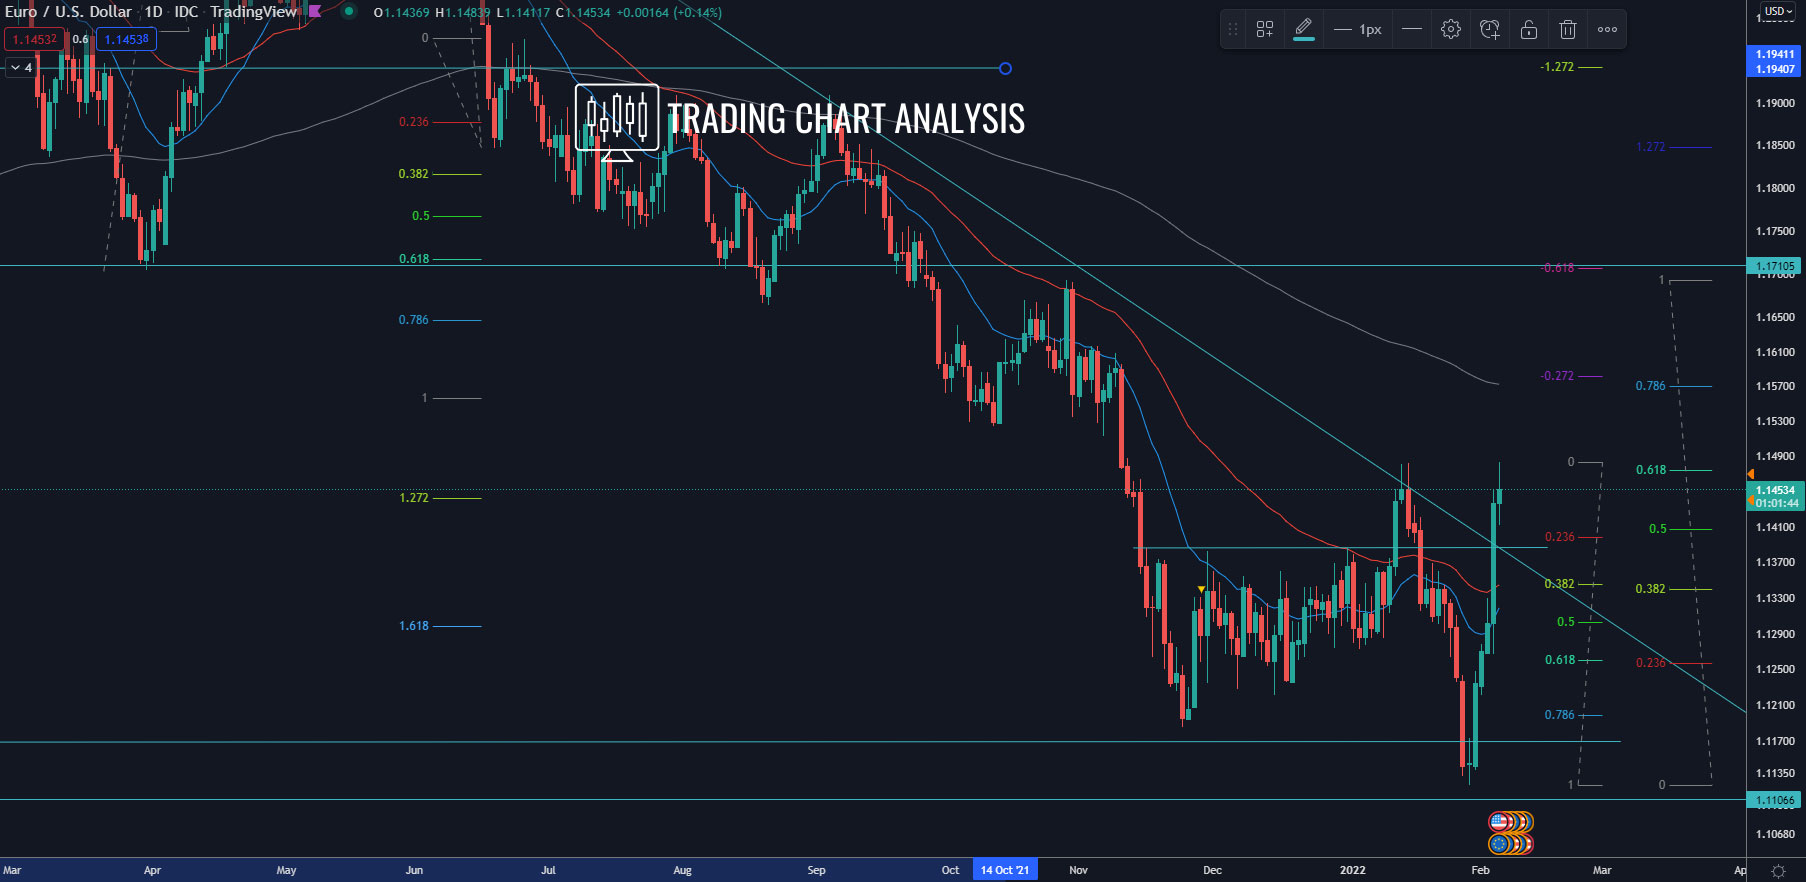
On the daily chart, if the EUR/USD breaks below the Friday low at 1.1409, it will signal a pullback. The first target for this potential daily pullback is the support around 1.1385. The second target for such a pullback on the daily chart is the 0.382 FIB retracement at 1.1345, which matches the daily 50 EMA. And a break below the 0.382 FIB retracement at 1.1345 will open the door for further declines toward the 0.618 FIB retracement on the daily chart at 1.1260.
Daily chart:
Weekly chart:
Monthly chart: