|
Getting your Trinity Audio player ready...
|
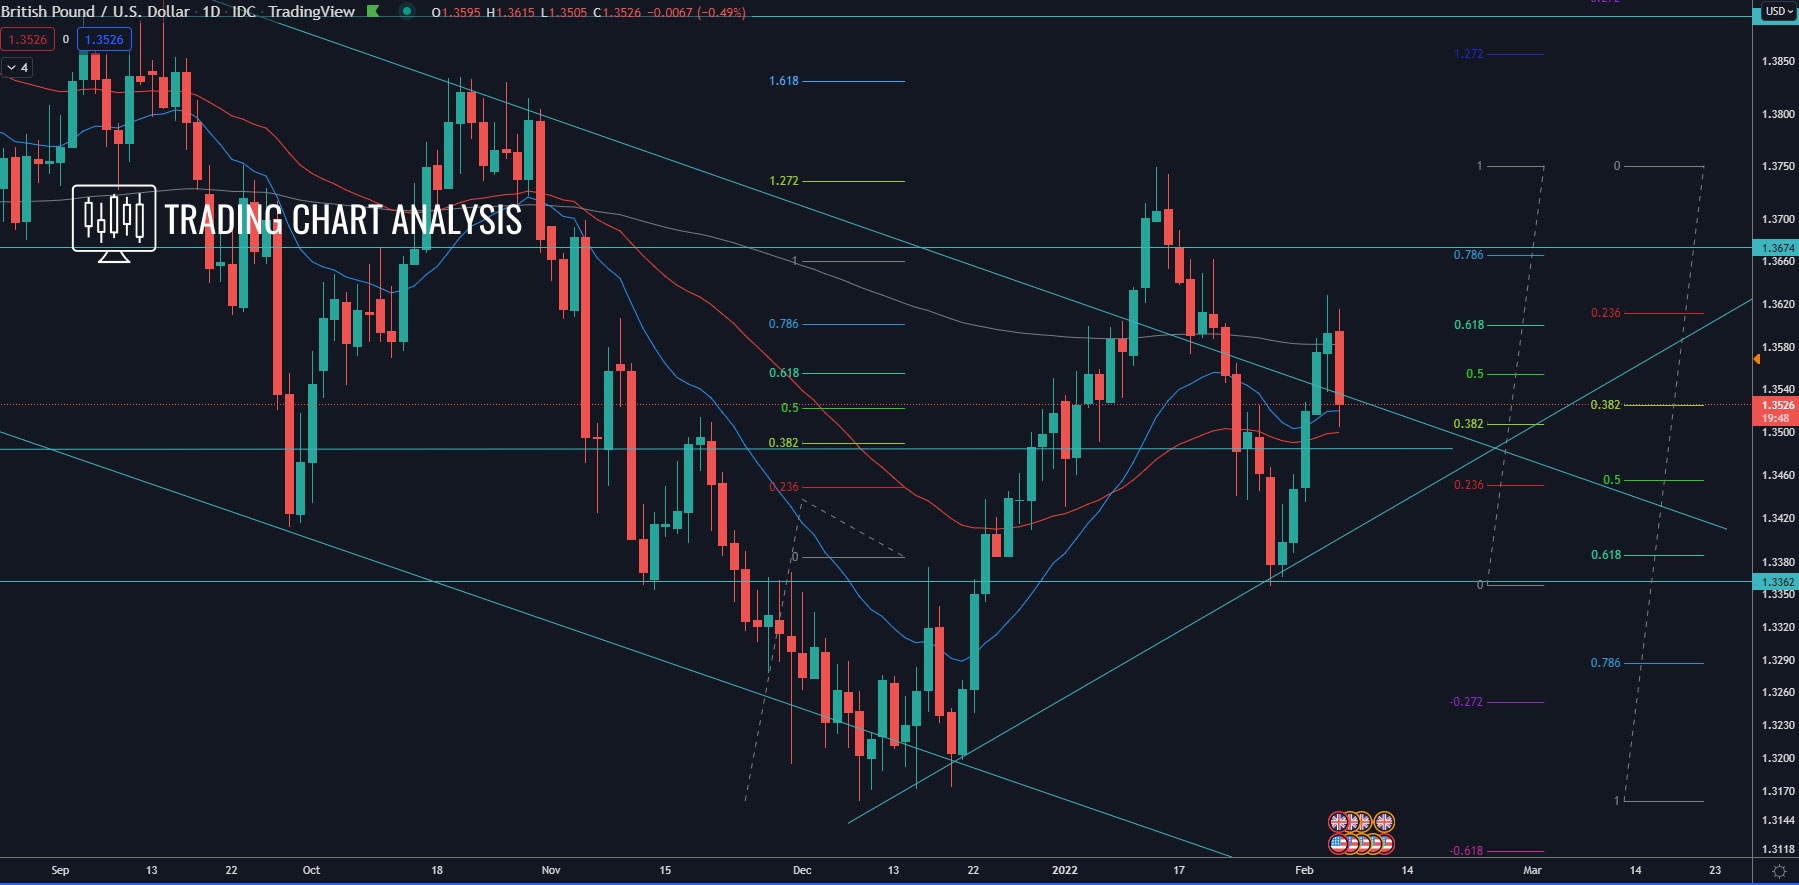
Technical analysis for the GBP/USD, the pair reached 0.618 FIB retracement on the daily chart at 1.3600 and rejected it with bearish engulfing candle forming a lower high. If the GBP/USD breaks below the Friday low at 1.3502, that will open the door for a decline toward the 0.618 FIB retracement on the four-hour chart at 1.3460. A break below 1.3460 will open the door for a bearish run toward the previous daily low at 1.3356.
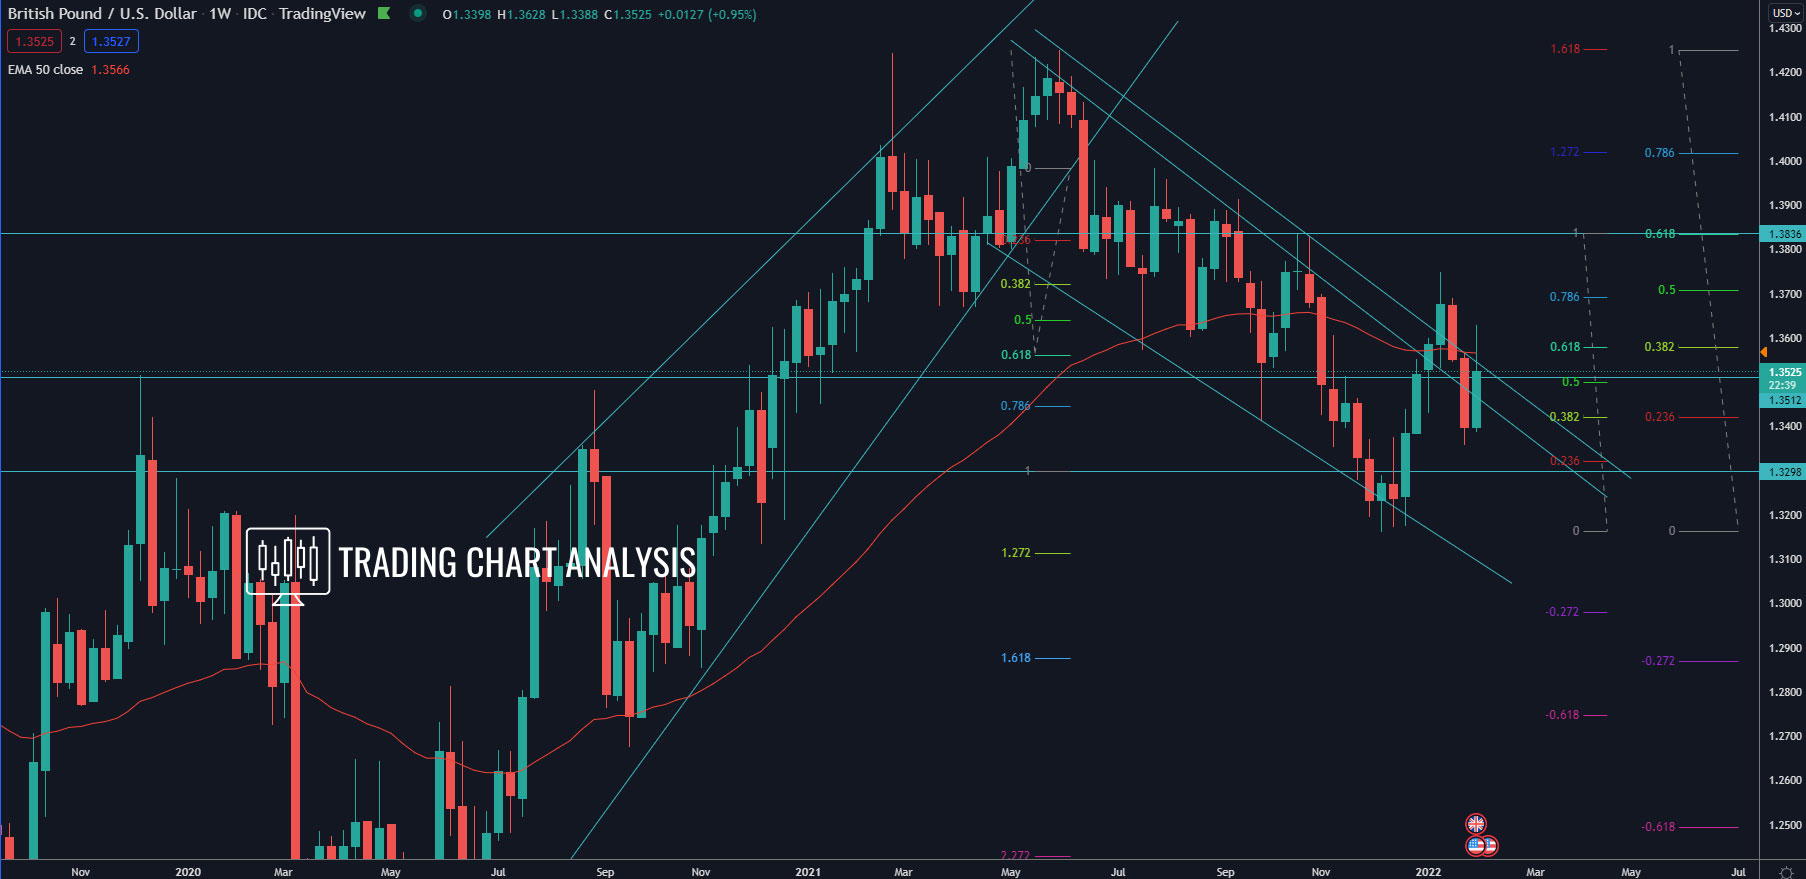
On the other hand, if the GBP/USD breaks above the last week’s high at 1.3628, it will start a bullish run toward the high at 1.3749. Furthermore, a break above the high at 1.3749, will resume the bullish daily run and send the GBP/USD higher toward the 0.618 FIB retracement on the weekly chart at 1.3835.
Daily chart:
Weekly chart:
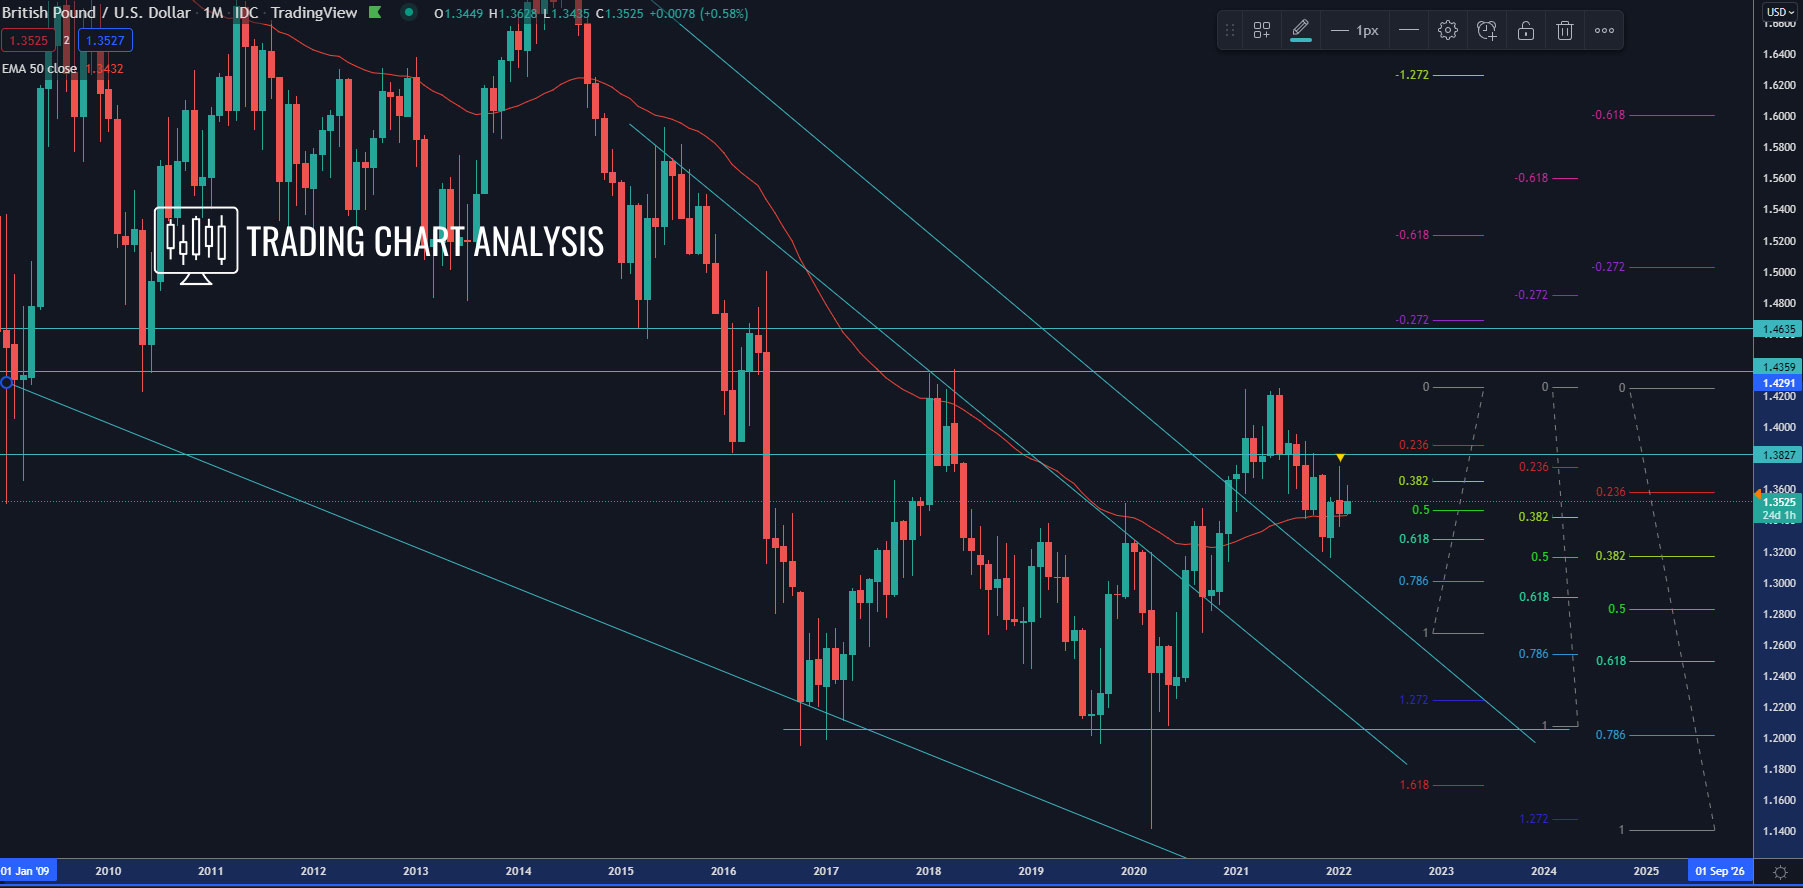
Monthly chart: