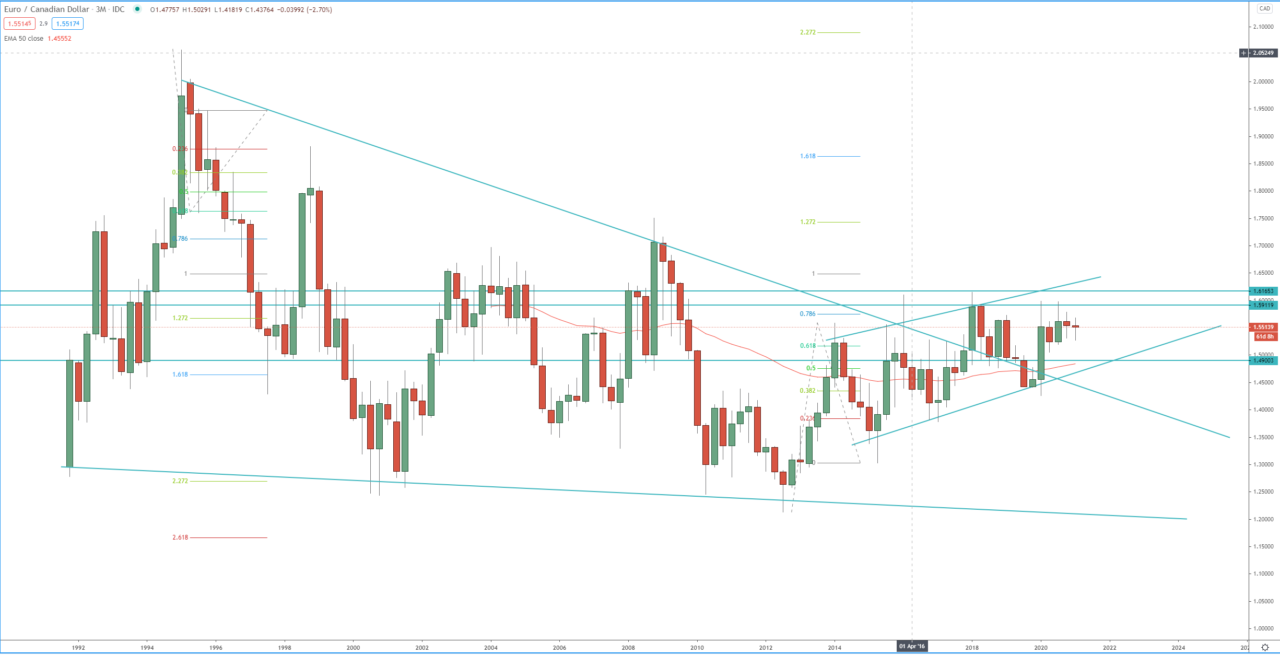
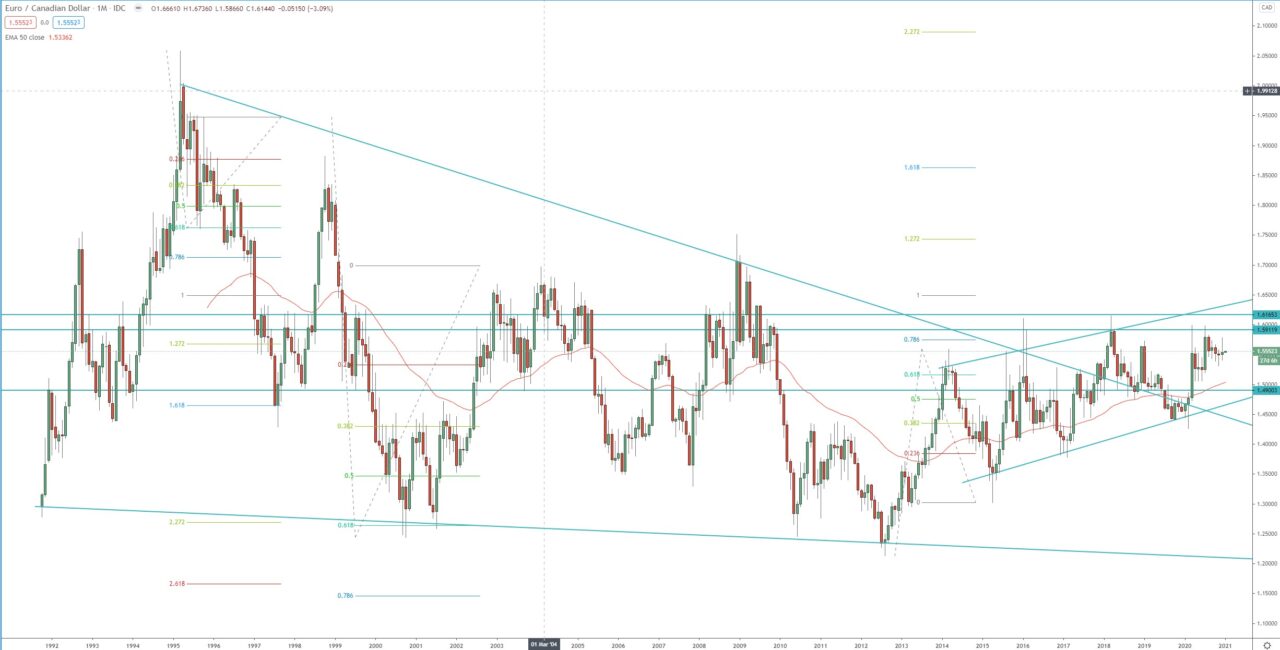
The quarterly and the monthly chart review that the long-term bearish trend has concluded in 2010 with double bottoms and bounce from dynamic support in 2012. That bounce led to the start of the new bullish trend which after the strong bullish momentum has been stuck in a choppy ascending channel. The first target of this monthly bullish run is the 1.272 FIB around 1.7400! However, before that, we need to see a break and hold above key resistance zone between 1.6000 – 1.6170.
Key support zone is between 1.5055 – 1.5070!
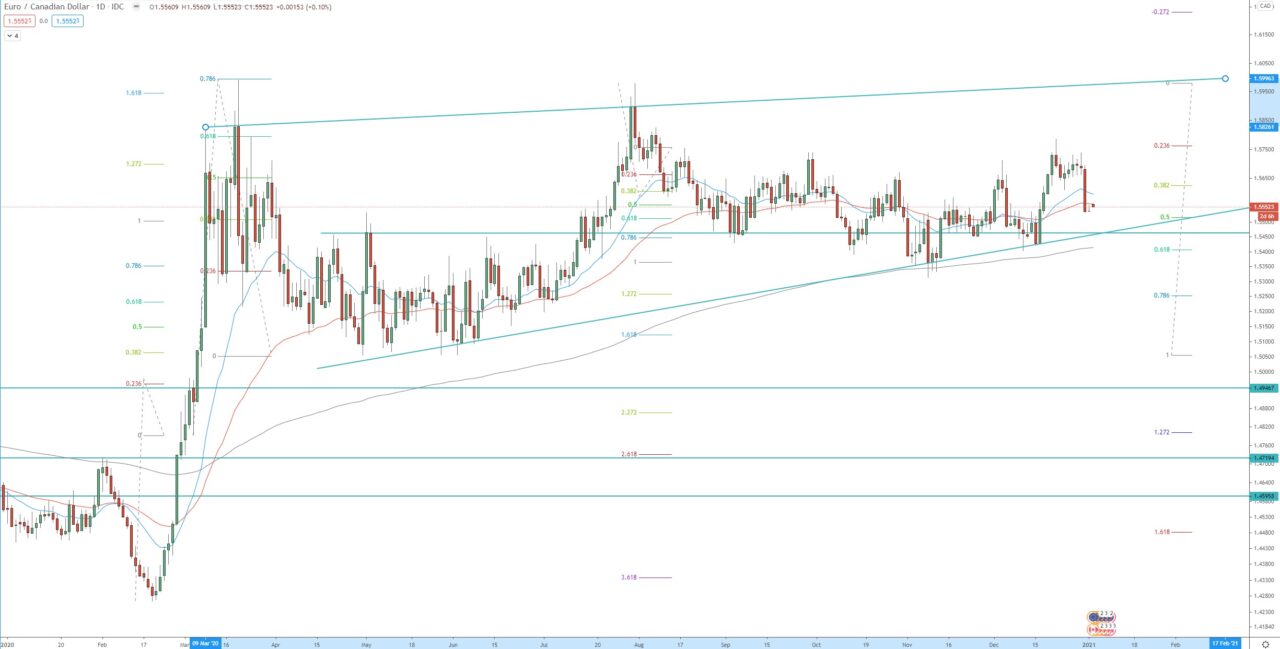
Short term analysis base on the daily chart is showing that the price is within a large bearish flag and perhaps has formed a double top, that structure should be watch carefully. Rejection of the top of that structure may lead to break below the support of the structure. If this break indeed materializes, we may see decline toward 1.5055 – 1.5100 support zone.
Short term resistance level to watch is between 1.5730 – 1.5780 we need to see sustainable break above that, in order to see another run toward the key resistance at 1.6000.
Quarterly chart:

Monthly chart:

Daily chart:


