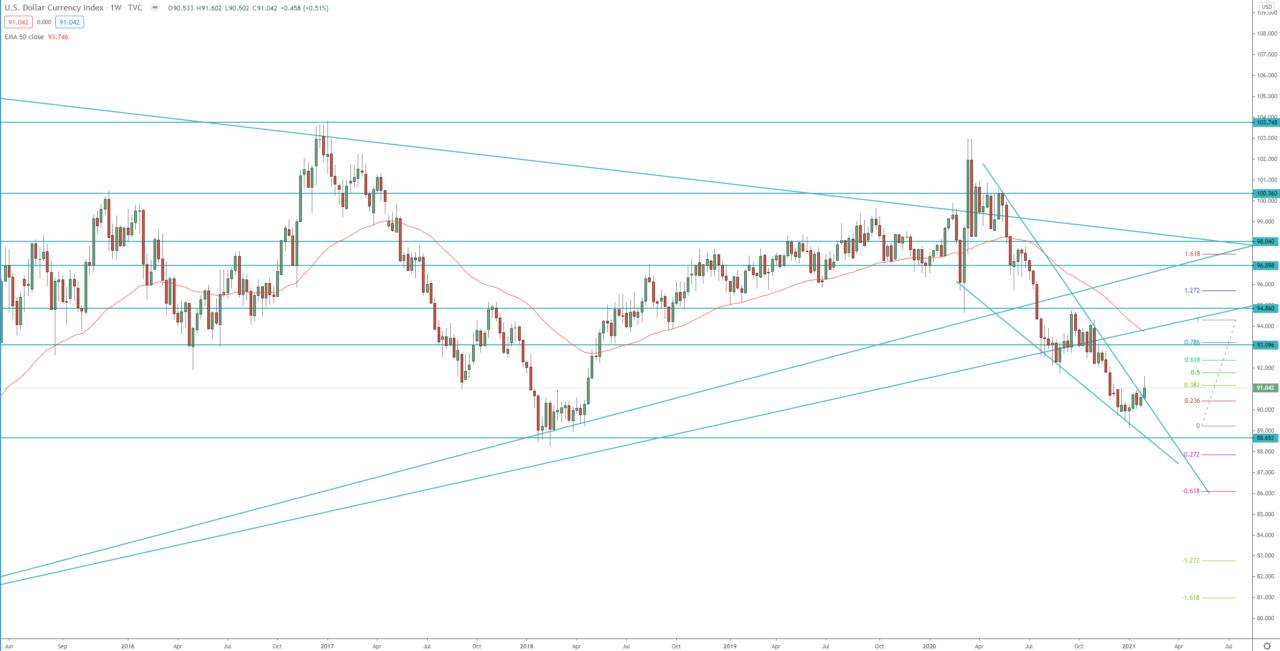
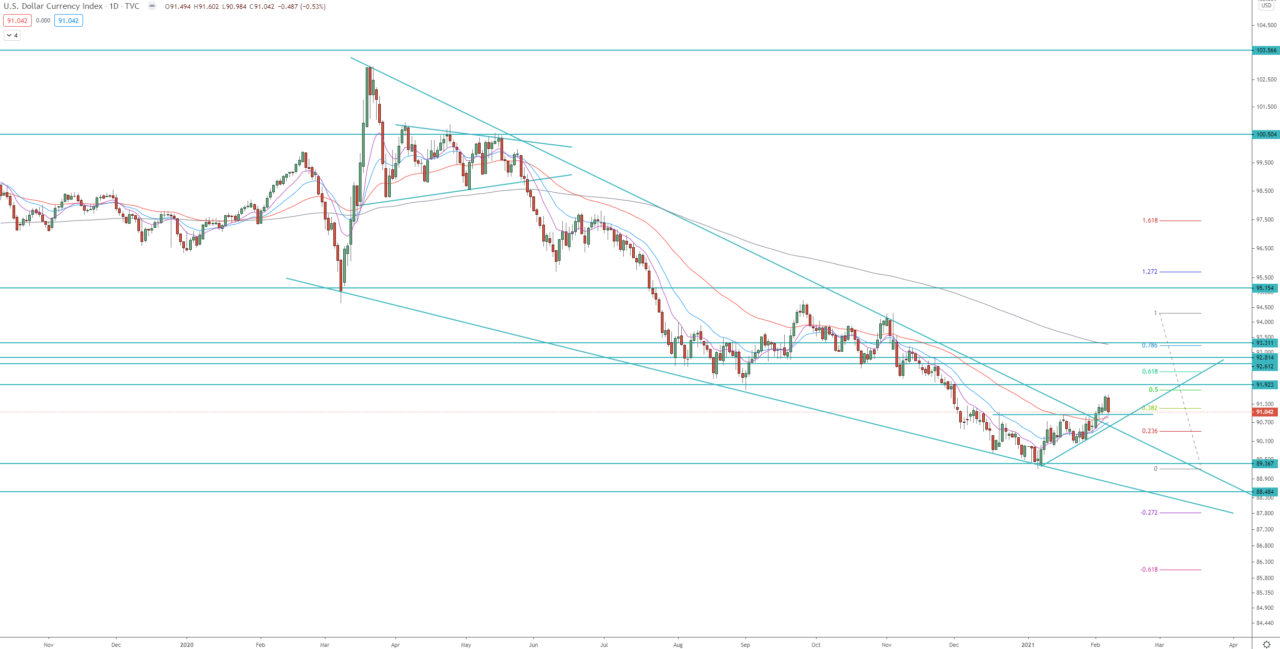
The DXY index is painting a different picture than the FXCM dollar index. The DXY broke above descending wedge on the weekly and the daily charts, and also broke above the previous daily high and double tops. The first target of that daily bullish run is at 1.272 FIB extension around 92.25, the second target is at 1.618 FIB extension around 92.85.
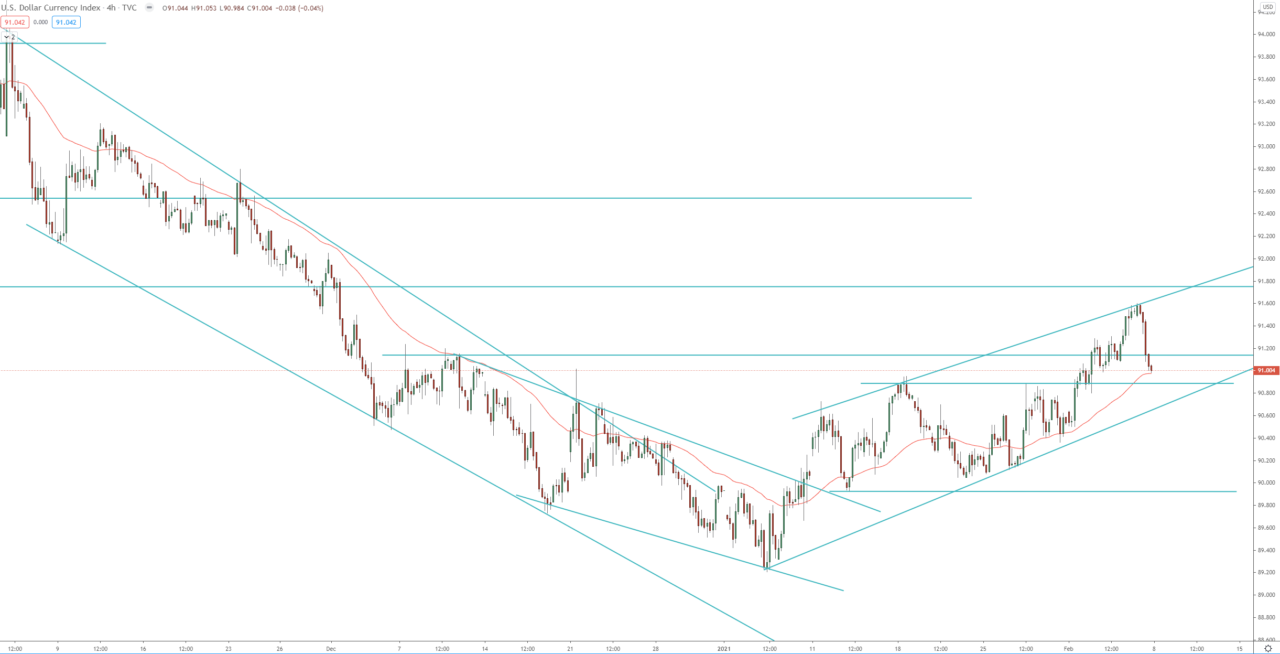
On the other hand, if the price break below the bearish flag on the 4H chart, that will be a signal for resumption of the bearish weekly, daily trend. Furthermore, a break below 89.90 will confirm that and send the price toward the previous low at 89.20 and then 2018 low toward 88.25.
Weekly chart:

Daily chart:

4H chart:


