|
Getting your Trinity Audio player ready...
|
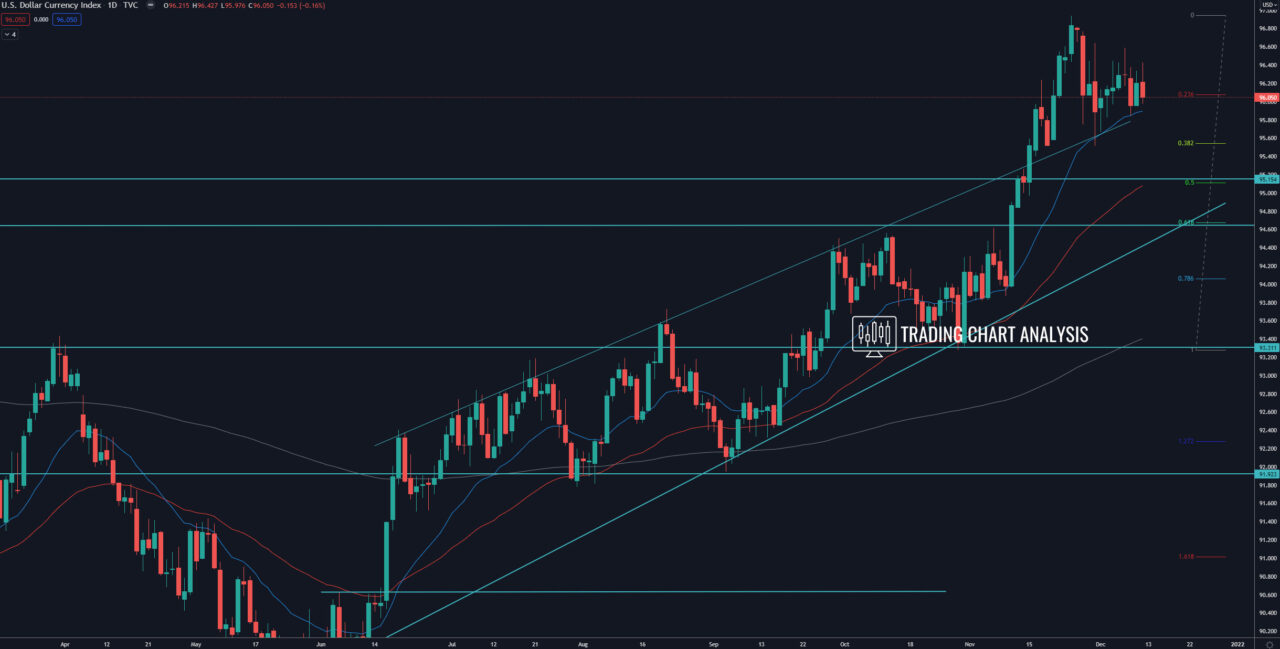
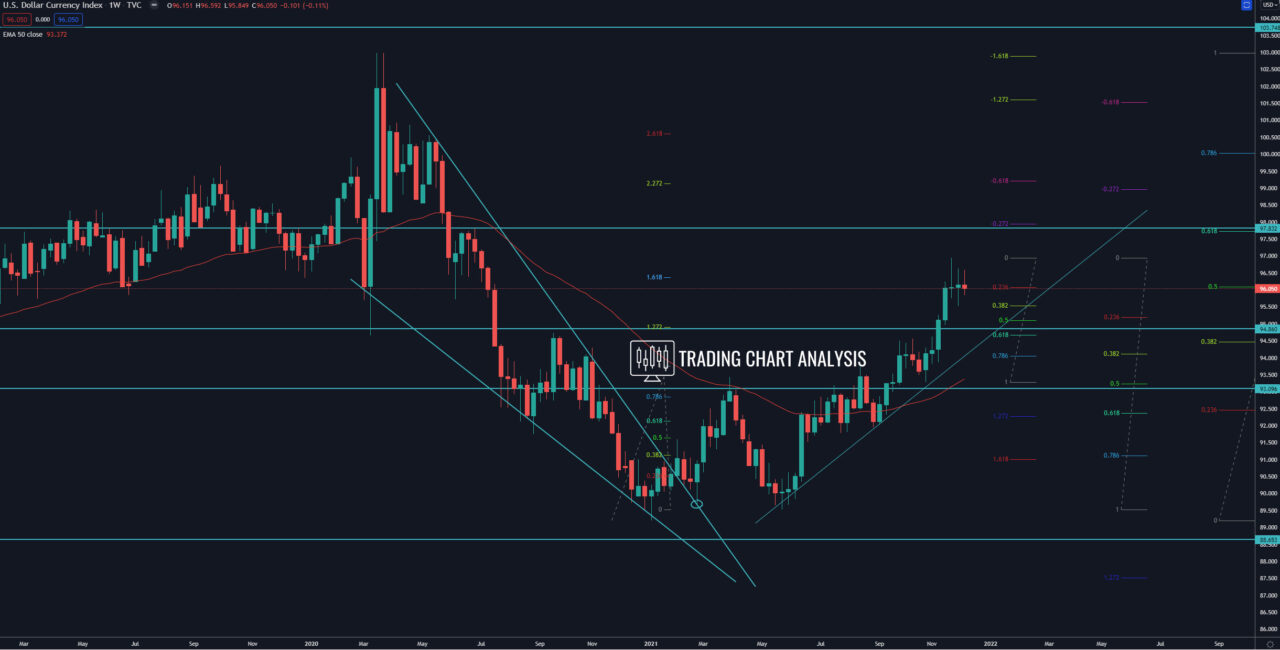
Technical analysis for the DXY dollar index, the index formed tweezer top on the weekly chart, which is a signal for a pullback. The first target for the pullback, the 0.386 FIB retracement at 95.55, was achieved. The second target is the 0.618 FIB retracement at 94.70.
If the DXY dollar index breaks below the 0.618 FIB retracement at 94.70, it will open the door for a bearish run toward the low at 93.27.
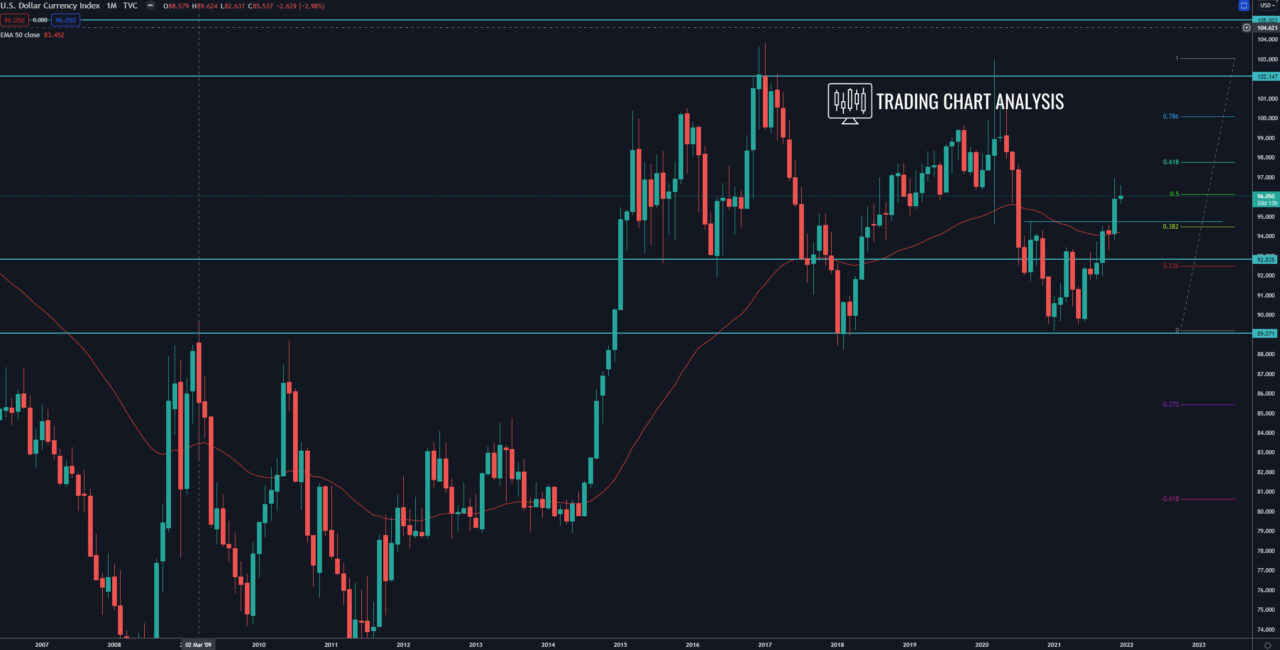
Looking at the bigger picture, the DXY dollar index broke above the resistance and the monthly high at 94.74. The target for this breakout is the 0.618 FIB retracement on the monthly chart at 97.75.
Daily chart:

Weekly chart:

Monthly chart:


