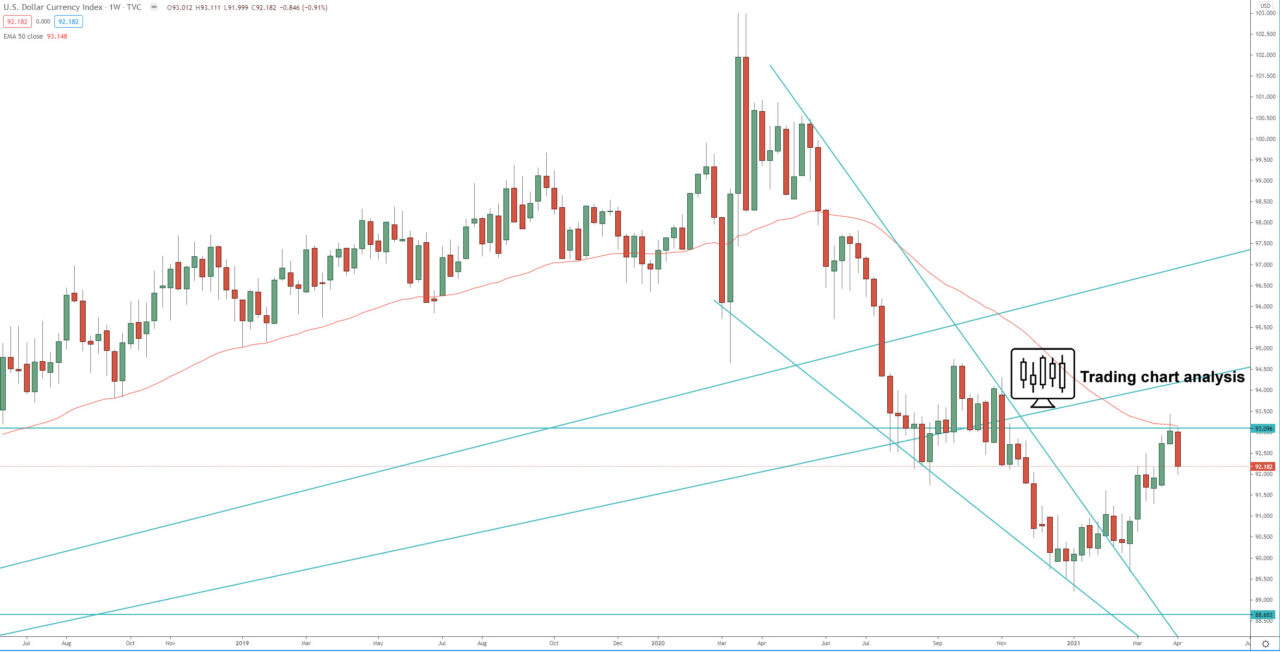
Technical analysis for the DXY dollar index is showing that the index formed an evening star pattern on the weekly chart, rejecting resistance, and signaling a potential resumption of the weekly bearish trend.
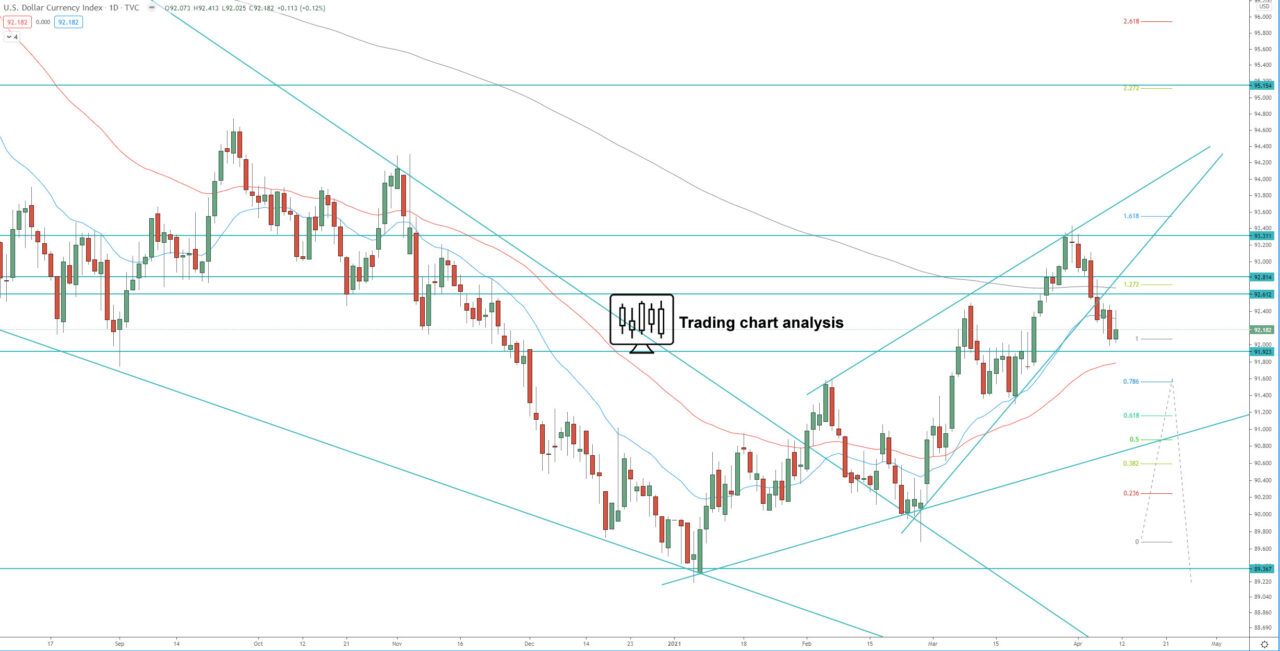
On the daily chart, the index reached the second target for the bullish daily run at 1.618 FIB around 94.55 and started a pullback which broke below the ascending trend line and support at 92.50. Further decline is in favor, toward the previous daily low at 91.35.
The focus for the week ahead is on the resistance zone between 92.50 – 92.80, if the DXY dollar index breaks back above that resistance, it will resume the daily bullish run and send the price toward the previous daily high at 94.43.
Review our technical analysis for the DXY dollar index for our 2021 targets.
Daily chart:

Weekly chart:


