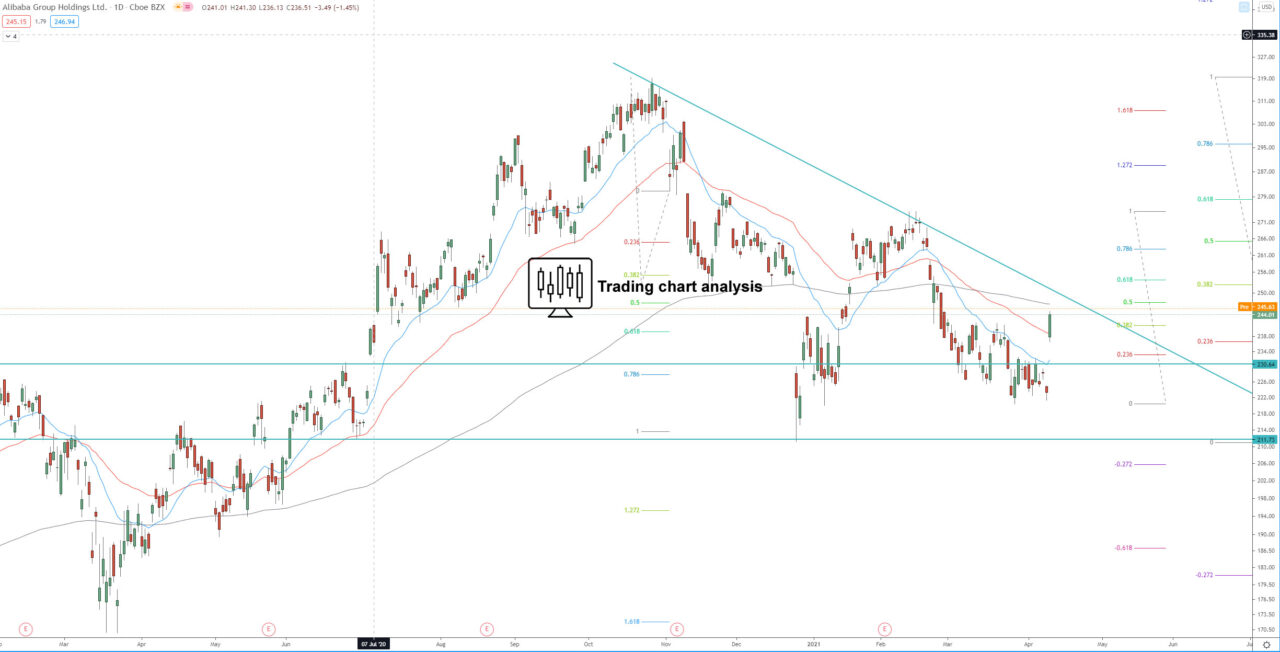
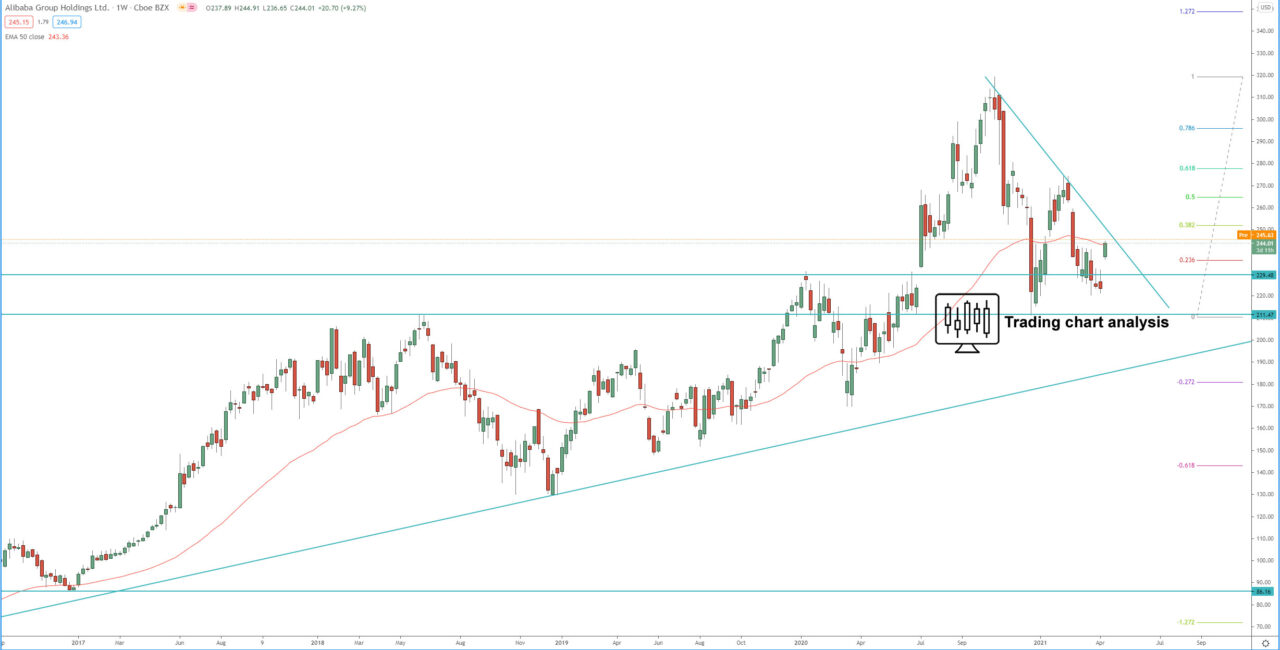
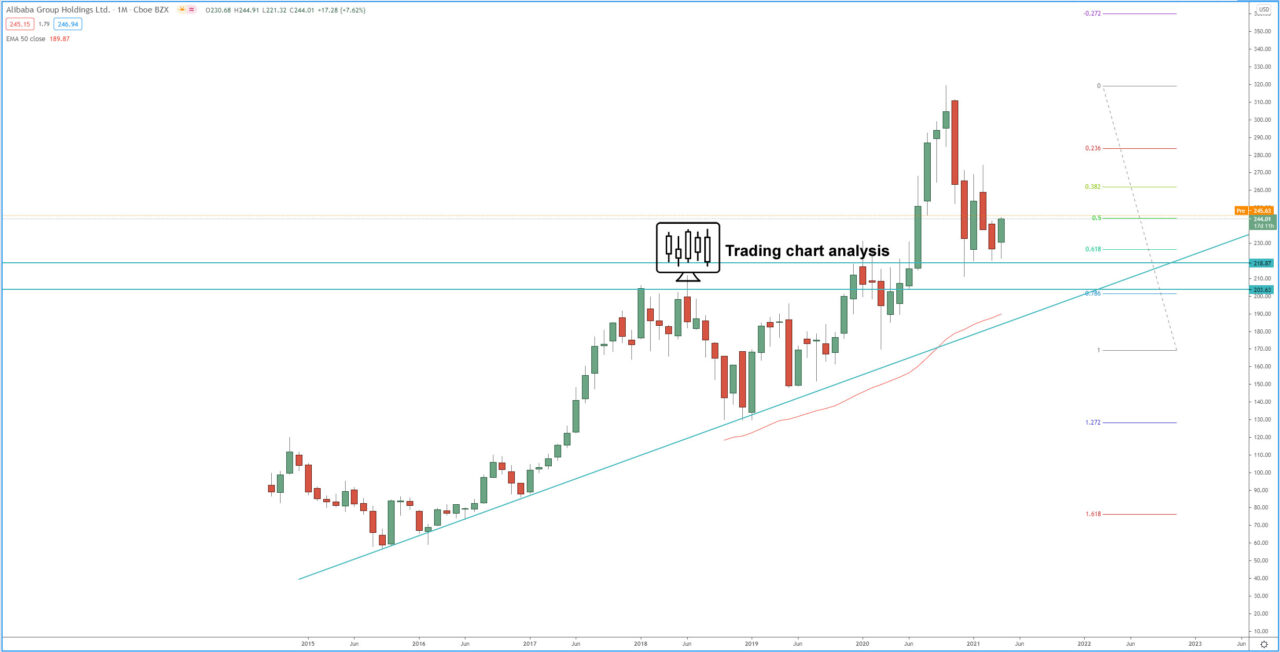
Technical analysis for Alibaba (BABA) is showing that the shares are within their 3rd bullish wave on the monthly chart. The shares almost reach the first target of that monthly bullish wave at 1.272 FIB extension at 325$, the price went as high as 319$ and started a pullback. This pullback is retesting the previous resistance now support zone around 230$ and 0.618 FIB retracement and bounced from it. On the daily chart, the shares of Alibaba (BABA) close above 241.70$, which is an early signal for the end of the consolidation and resumption of the bullish trend. The focus ahead is on the descending phase line, if the price break above it, it will be a signal for further upside toward 274$.
If the shares of Alibaba (BABA) breaks above 275$, it will be a signal for resumption of the bullish trend, and it will send the price higher toward, first the previous high at 319.32$, and second toward the 1.618 FIB extension of the 3rd monthly bullish wave at 380$.
On the other hand, if the shares of Alibaba (BABA) breaks below the previous low at 211.23$, it will send the price lower toward, first 1.272 FIB extension of the daily bearish run at 195, and second toward 1.618 FIB extension at 172$.
Daily chart:

Weekly chart:

Monthly chart:


