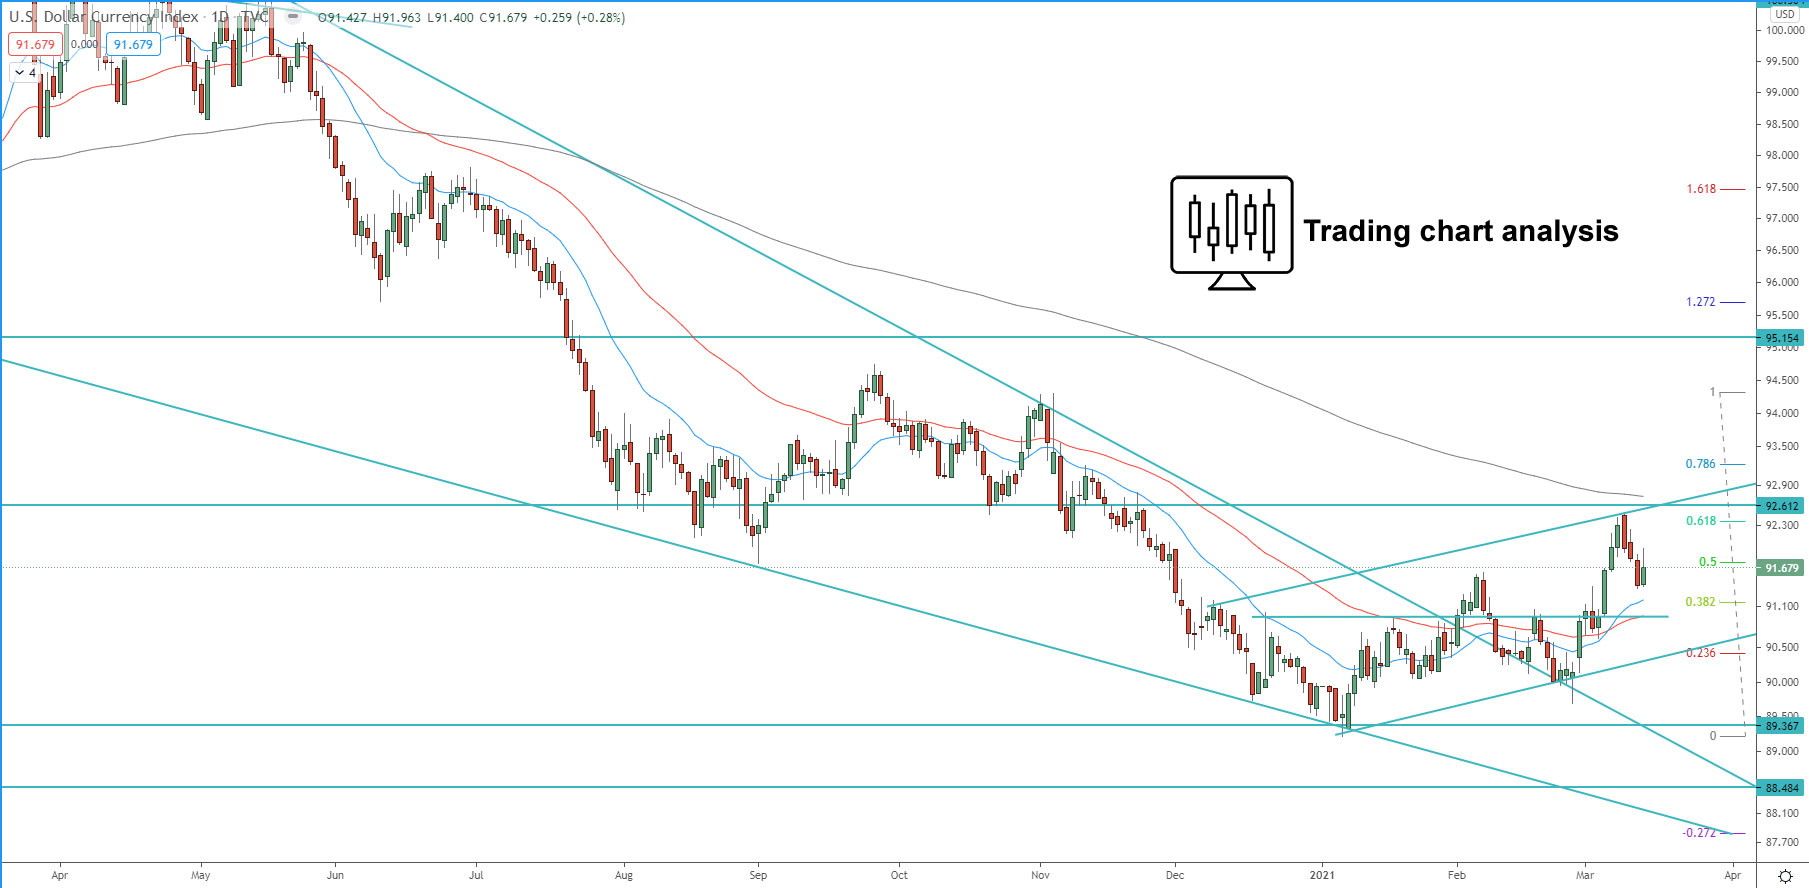
Not a lot changed in the past week. After the initial breakout in the daily chart, the price pulled back to retest the breakout. The first target of this breakout is the 1.272 FIB extension at 92.70, the second target is the 1.618 FIB extension at 93.50.
On the other hand, if the price breaks below 90.60, that will be a signal for resumption of the bearish weekly and daily trend, which will be an early signal for potential further declines toward, first 90.10, second toward 89.70, and break below that will send the price toward previous low at 88.96 and eventually toward the 2018 low at 88.25.
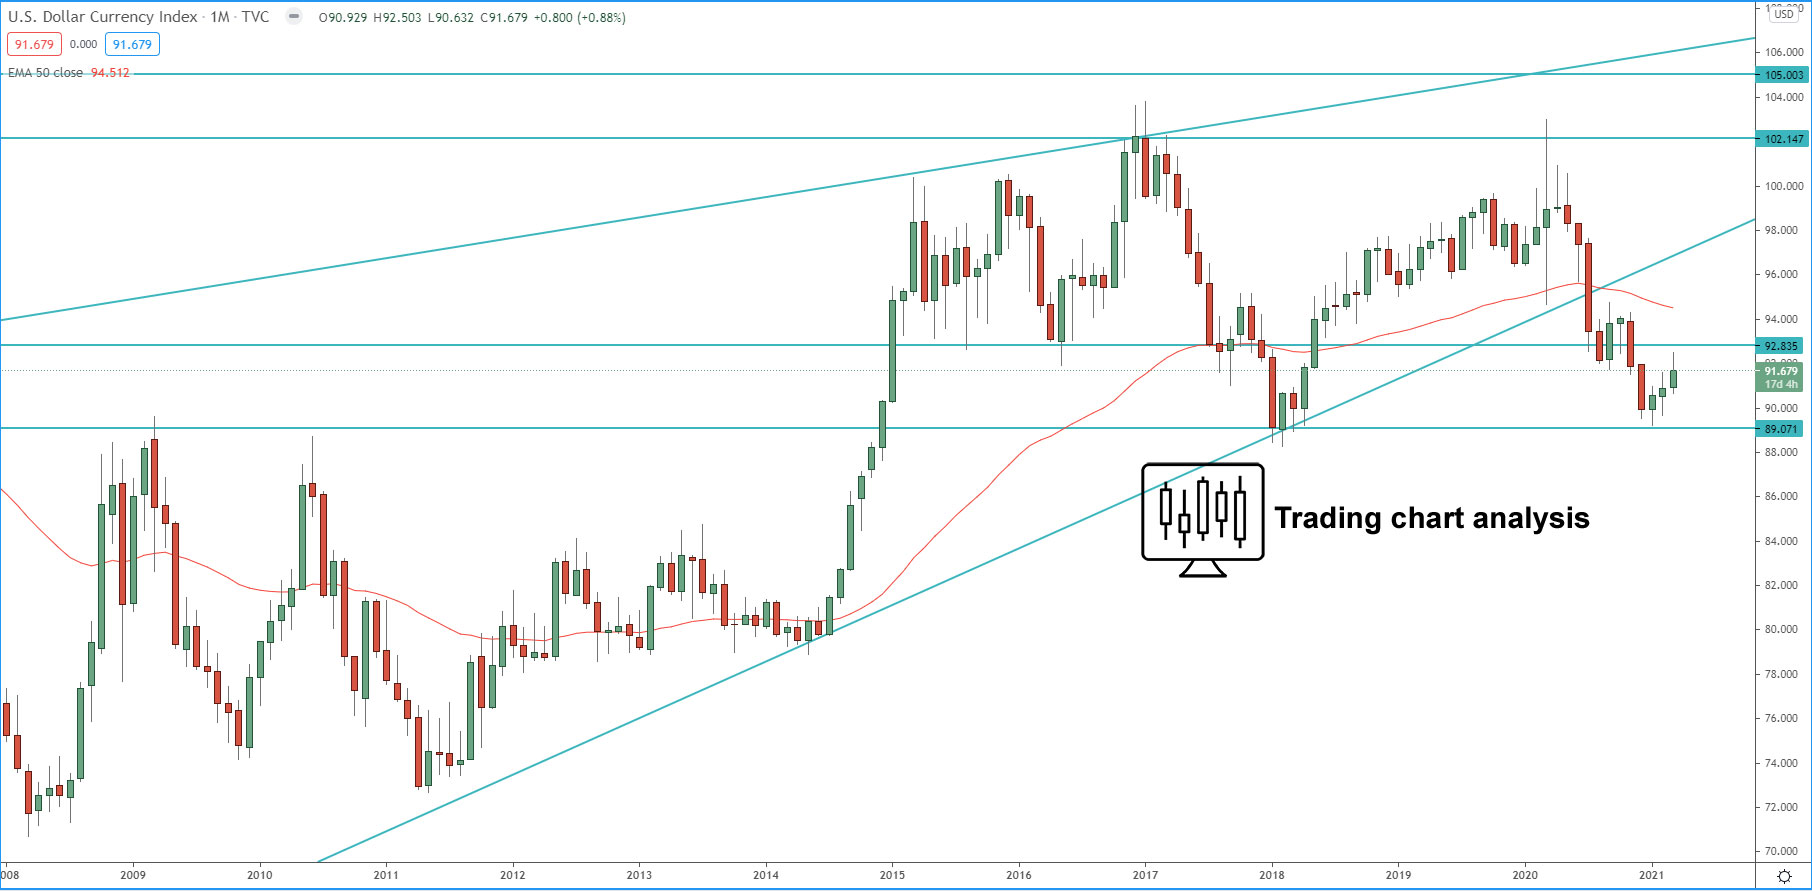
Monthly chart:
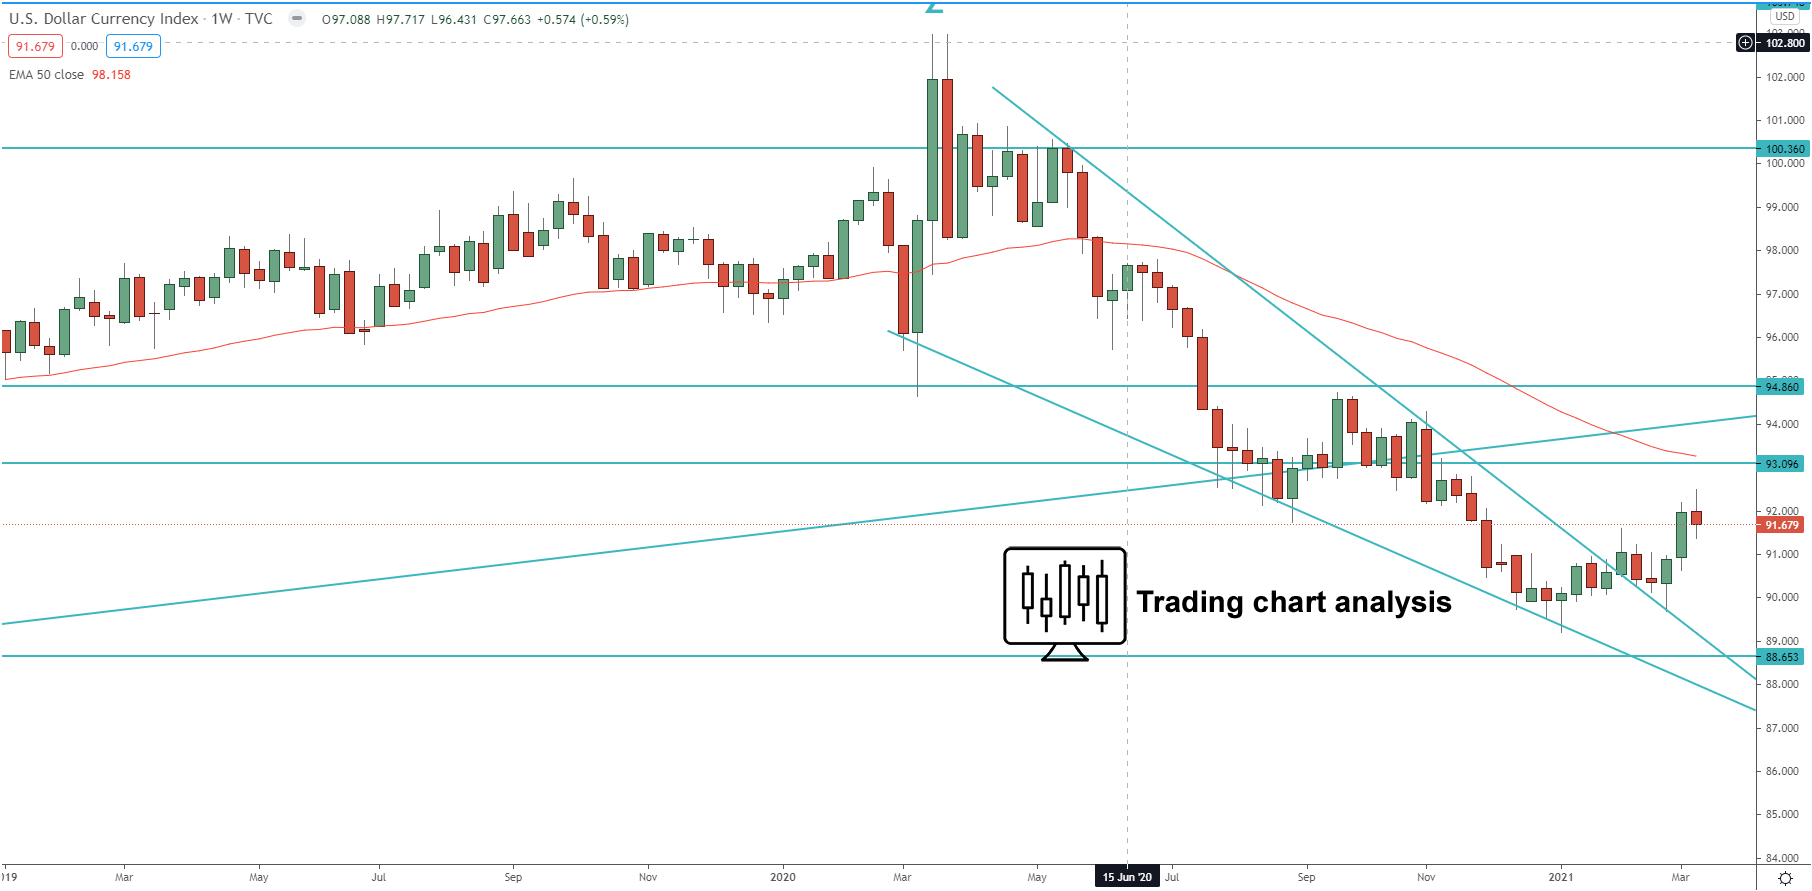
Weekly chart:
Daily chart: