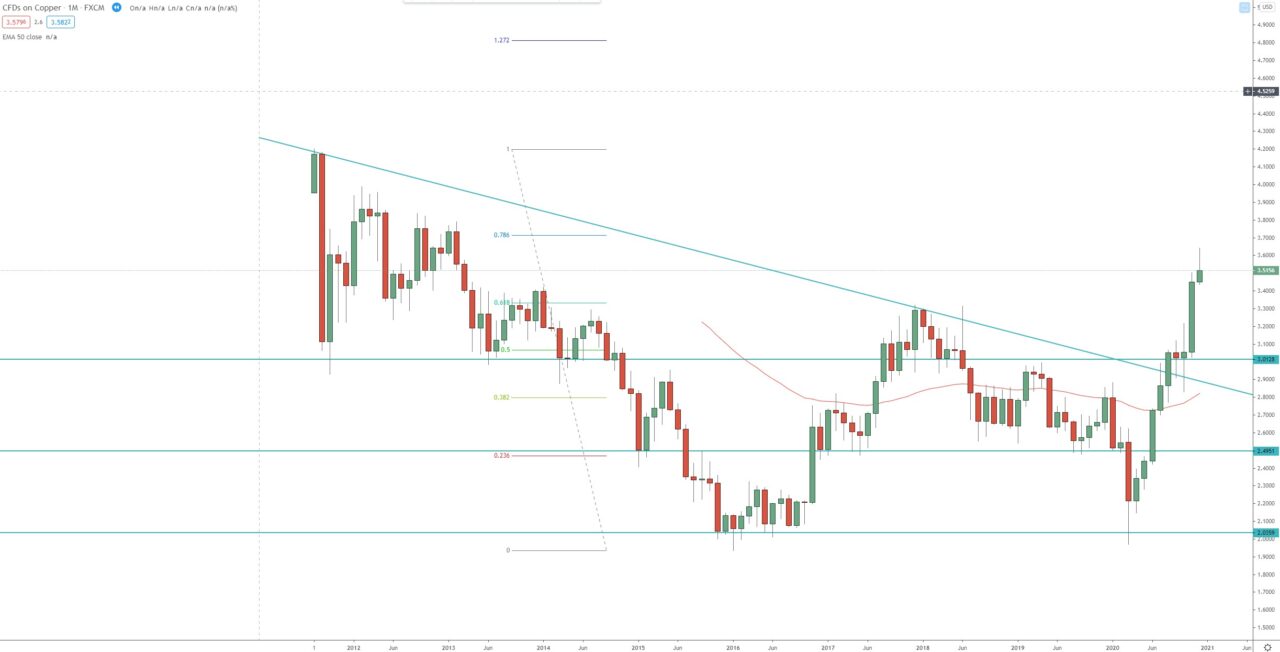
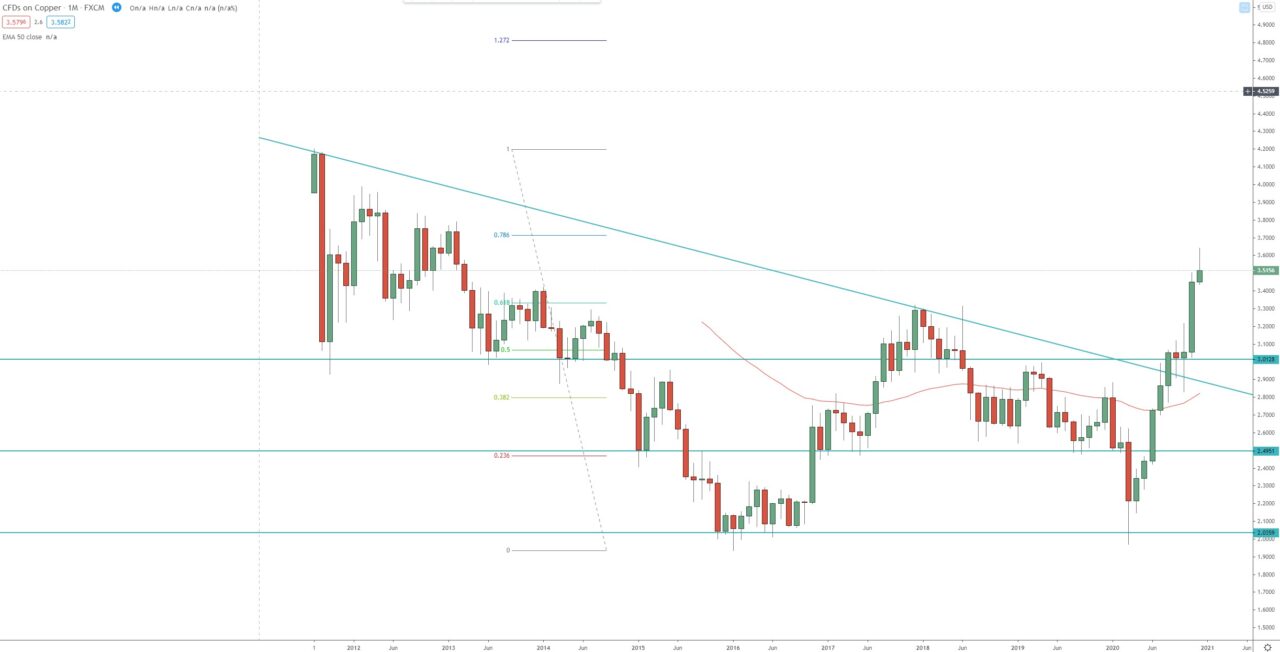
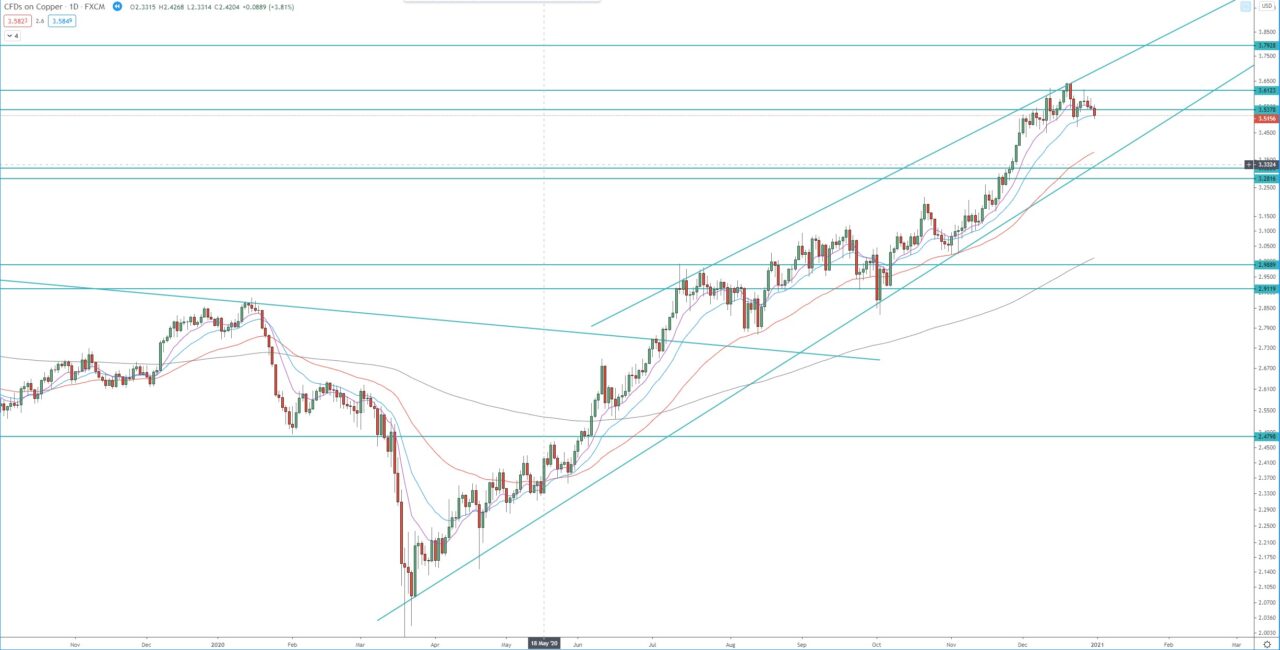
After the initial plunge during the COV19 pandemic, the price bounced from the support zone around the 2016 lows, around the 2.00. That bounce led to break above 2.88 and after that, break above 3.00 where we had strong horizontal and dynamic resistance, looking at the monthly chart. That break start the 3rd wave of the bullish weekly run and extended the 3rd wave of the daily bullish trend.
The second target of the 3rd daily bullish wave is at 1.618 FIB extension around 3.71, next target is the 2.272 FIB extension around 4.18, where we have the 2011 high. Before that there is a resistance zone between 4.00 – 4.07 which is the first target of the 3rd weekly bullish wave.
Monthly chart:

Weekly chart:

Daily chart:


