technical analysis for 7 – 13 February 2021.
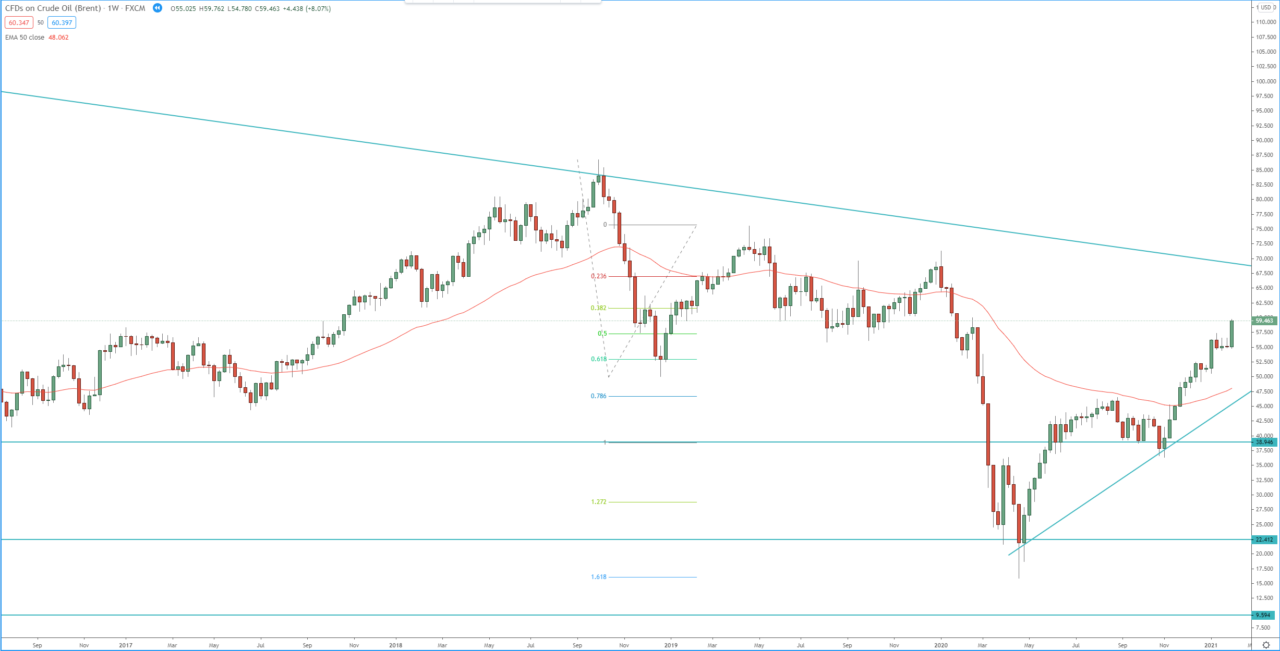
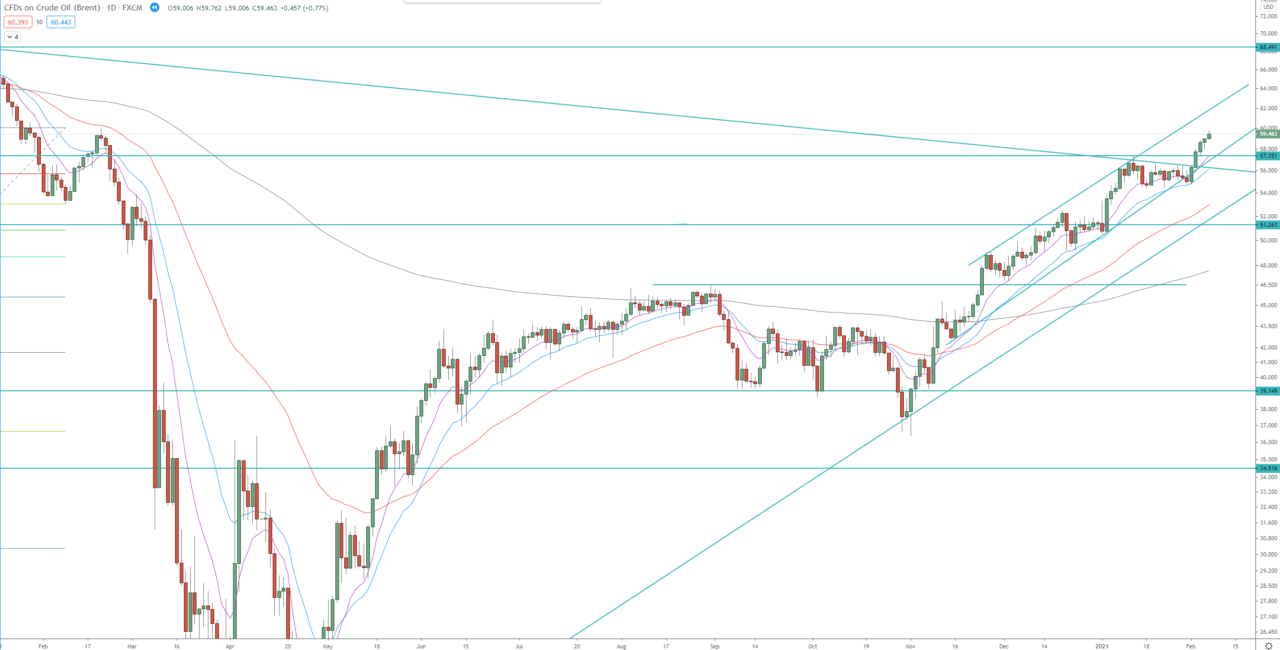
The price broke above 3 weeks range on both the weekly and the daily charts, clearing the way toward the first target of this daily bullish wave at 1.272 FIB extension around 60.50. This break higher, also broke dynamic resistance, descending trend line and that is signal that potential further upside is on the way, toward the second target of the 3rd bullish daily wave toward 1.618 FIB extension around 67.70.
Review all 2021 technical analyses for Brent Crude Oil for more details.
In case of a pullback, the support area between 57.35 – 55.00 should be watched for retest, rejection, and resumption of the bullish daily trend.
Weekly chart:

Daily chart:


