Technical analysis 7 – 13 FEBRUARY 2021
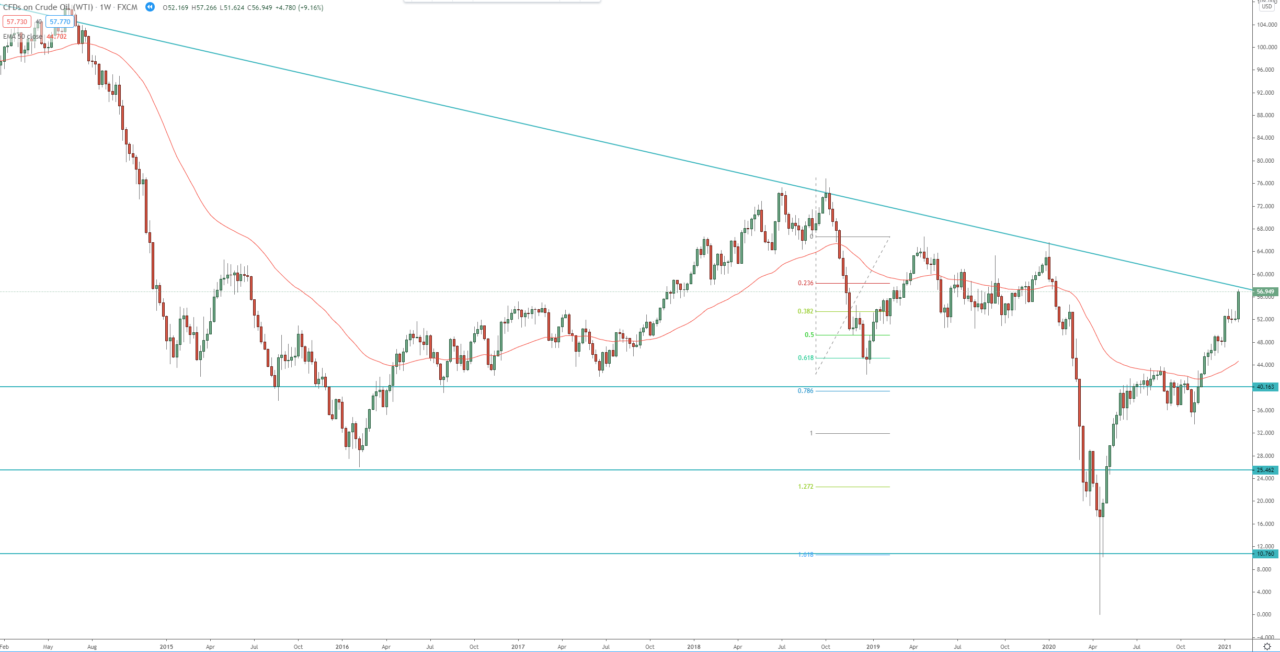
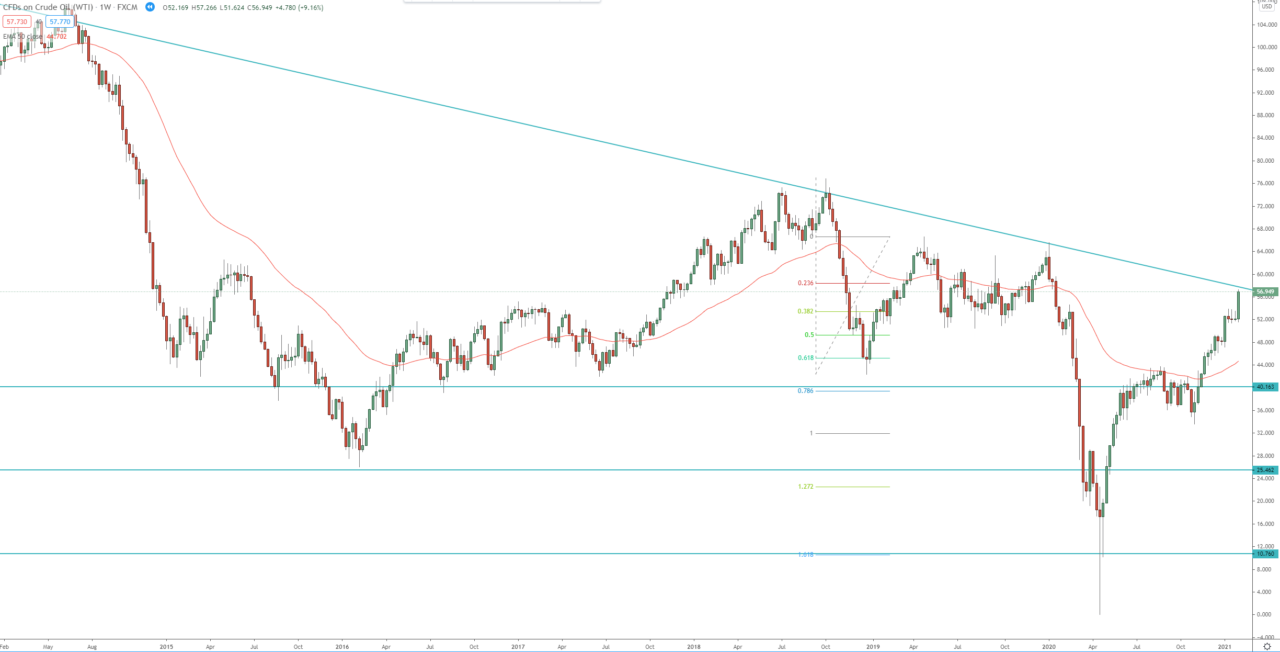
The price broke 3 weeks range to the upside on both the weekly and the daily charts, also on the daily chart the price broke above dynamic and horizontal resistance, above 54.60, clearing the way for the next strong resistance zone between 59.20 – 60.00, around this resistance zone there is long-term dynamic resistance, descending trend line, we need to see a break above that trend line before we can talk about the further upside.
Previous resistance is now strong support around 54.20 – 54.60 and in case of a pullback, it may provide support, rejection, and resumption of the bullish trend.
Weekly chart:

Daily chart:


