|
Getting your Trinity Audio player ready...
|
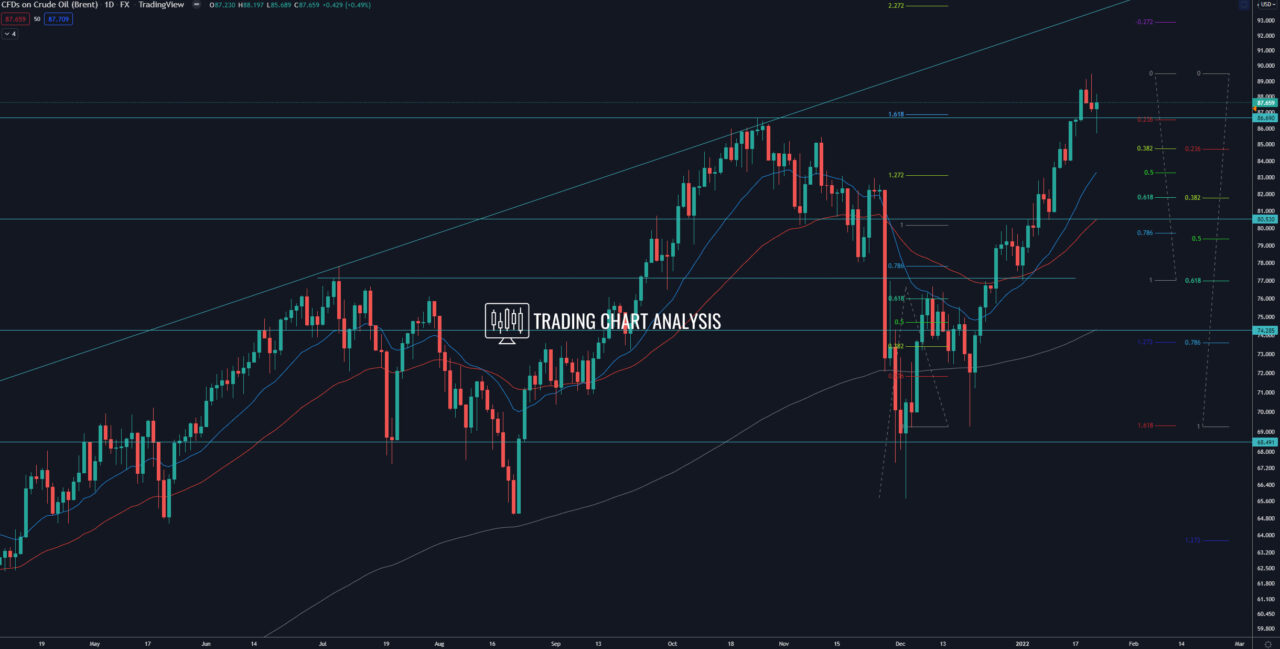
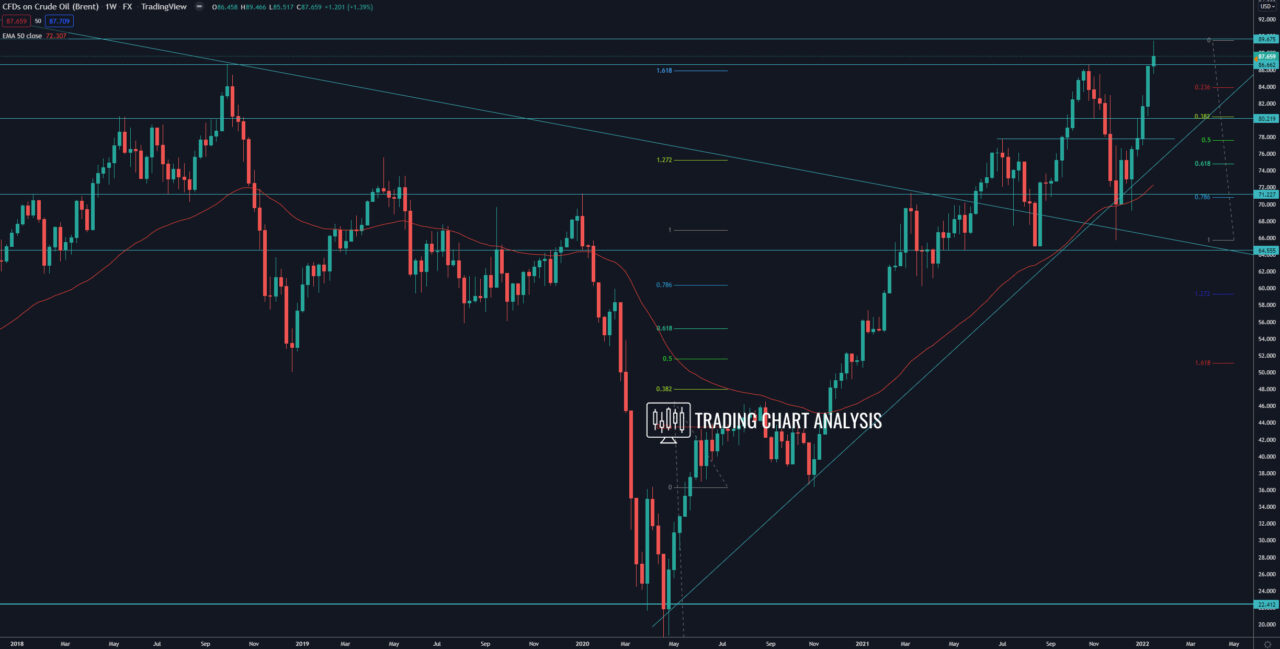
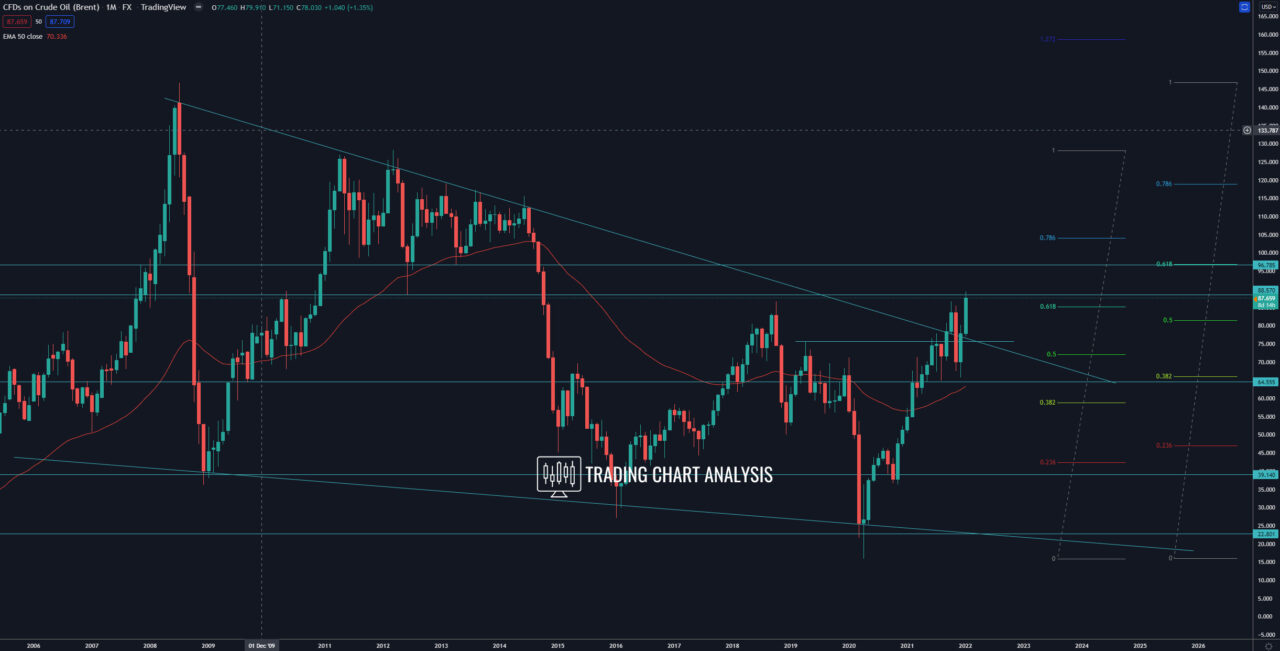
Technical analysis for Brent Crude Oil, the price broke out on the weekly and the daily charts, a signal for further upside potential. The next target for the latest bullish run on the daily chart is the 2.272 FIB extension at 94.00$ and the 2.618 FIB extension at 97.80$. On the monthly chart, the 0.618 FIB retracement is at 97.00$, which is also a target for the bullish run. However, the current breakout looks a bit weak, and the price is within a resistance zone between 88.50 – 89.50$. Therefore, we need to see the Brent oil trading and holding above 89.50$ to confirm the bullish breakout and clear the way for a run toward 97.00$.
Looking at the weekly chart, the price of Brent Crude Oil reached and exceeded the second target of the bullish wave, the 1.618 FIB extension at 85.80$. The third target of the bullish wave on the weekly chart is the 2.272 FIB extension at 106$.
However, on the daily chart, the price of Brent oil formed a tweezers top, RSI sells signal, and Stochastic RSI bearish divergence, which is a signal for a pullback. If the price break below the Friday low at 85.69, it will open the door for a bearish run. The first for this pullback is the 1.272 FIB extension on the four-hour chart at 83.45. The second target is the 1.618 FIB extension at 82.10, and the third target is the 0.382 FIB retracement on the daily chart at 81.80.
Daily chart:

Weekly chart:

Monthly chart:


