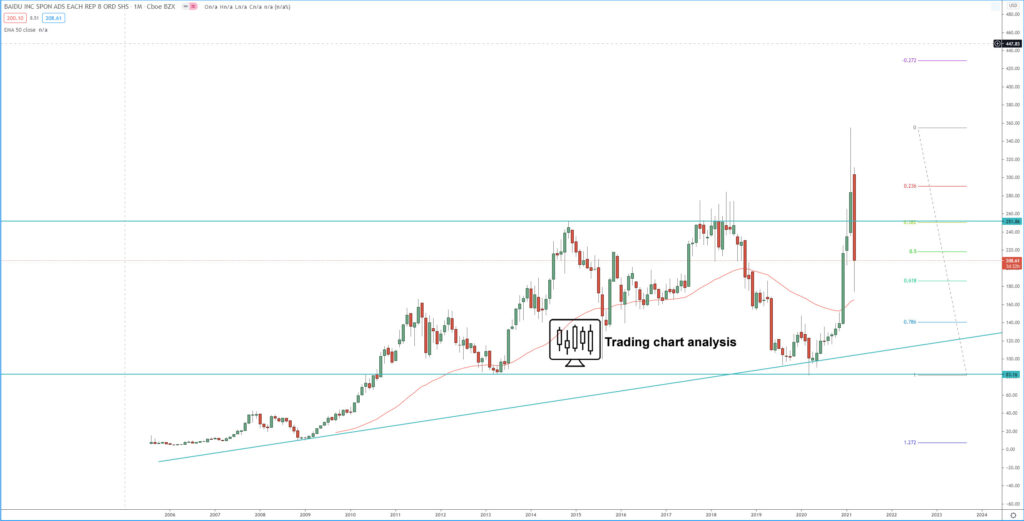
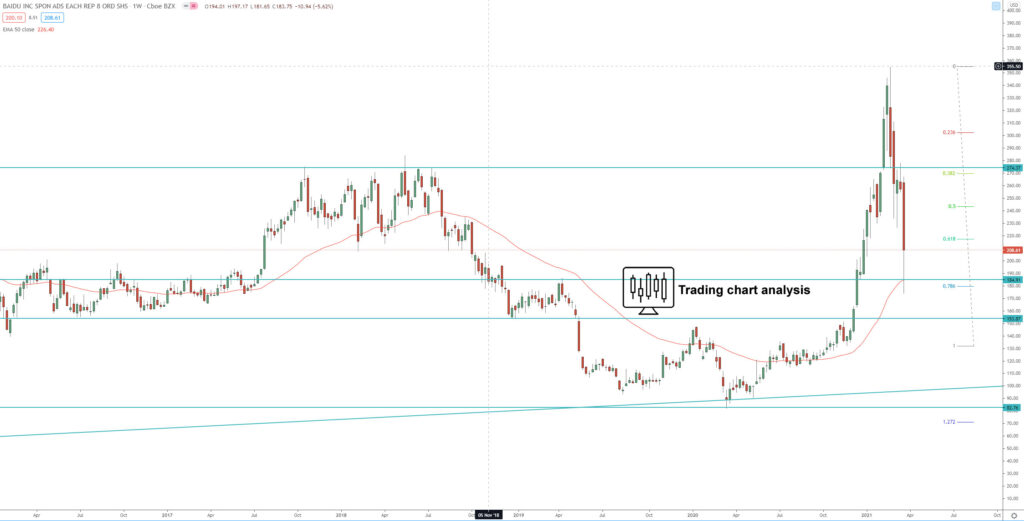
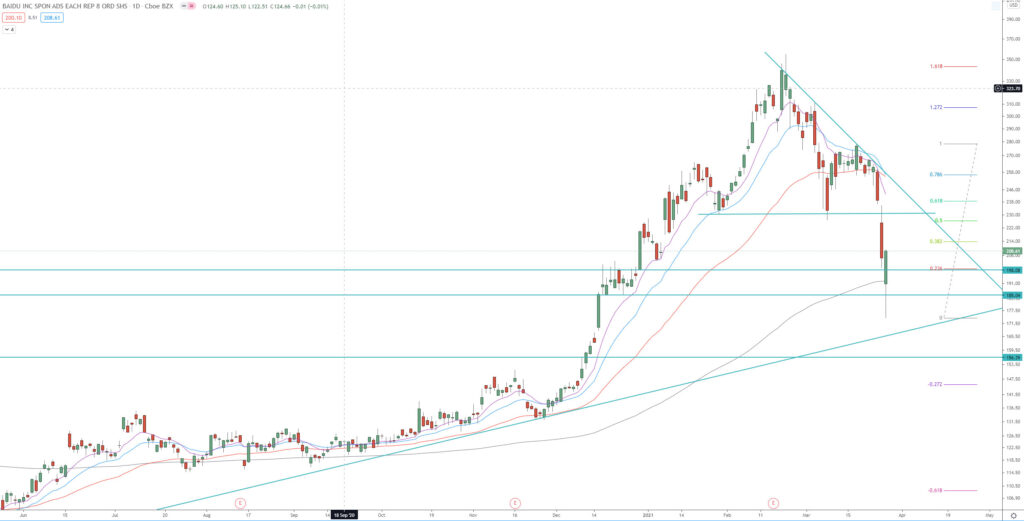
Technical analysis for Baidu (BIDU) stock is showing that the shares reached the 1st target of the 3rd bullish monthly wave at 1.618 FIB extension at 345$ and started a fast -50% decline that reached the 0.618 FIB retracement on for the last bullish run on the monthly chart. The decline on the monthly chart materializes as a full breakout on the daily chart. The second target of this breakout was at 1.618 FIB extension at 180.00, was reached, the price went as low as 174$. If the price break below 174$, further decline is in favor, toward the support around 155$.
On the other hand, if the price breaks back above 279$, it will be a signal for resumption of the bullish daily trend, and it will send the price toward the previous high at 354$. If the price break above 354$, that will be a signal for extension of the 3rd bullish monthly wave for the Baidu (BIDU) shares and send the price toward 2.272 FIB extension around 445$ – 450$.
Monthly chart:

Weekly chart:

Daily chart:


