|
Getting your Trinity Audio player ready...
|
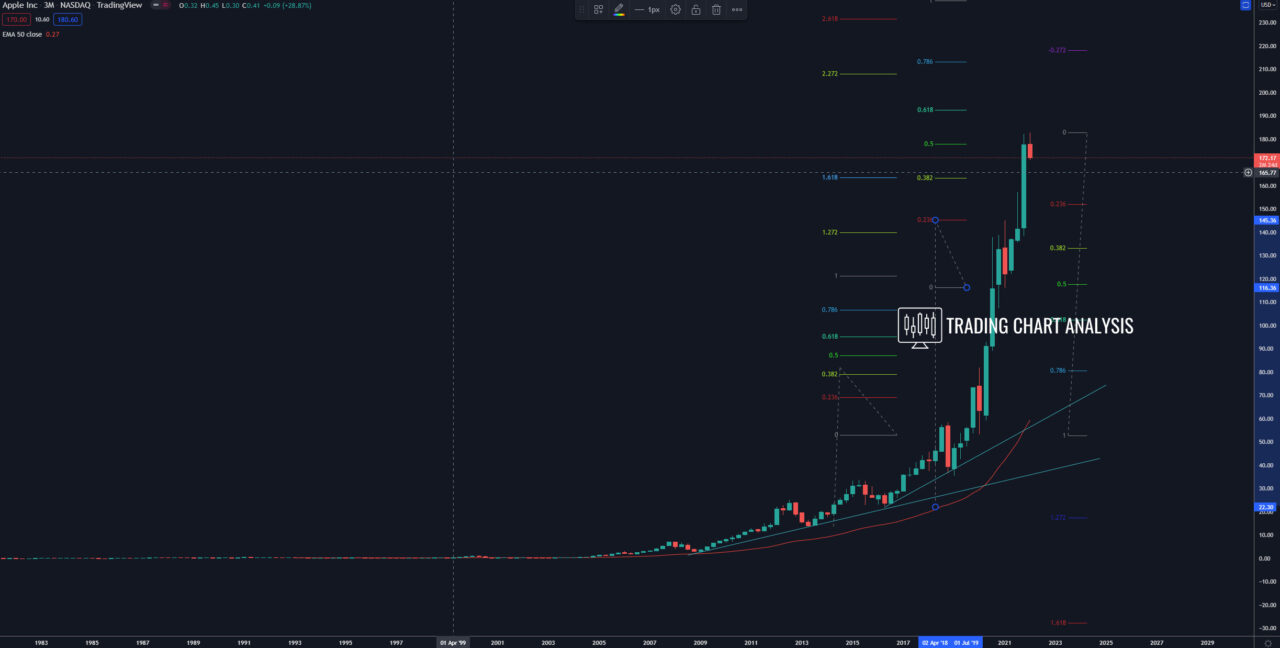
Technical analysis for Apple, the shares are within their fifth bullish wave on the quarterly chart. Depending on how you count the waves, the shares reached 1.618 or the 0.382 FIB extensions on the quarterly chart at 163$. The next target for the bullish wave is the 0.618 FIB extension on the quarterly chart at 192$. A break above 192$ will open the door for a bullish run toward the next target at the 2.272 FIB extension at 208$ and possibly the 2.618 FIB extension at 230$.
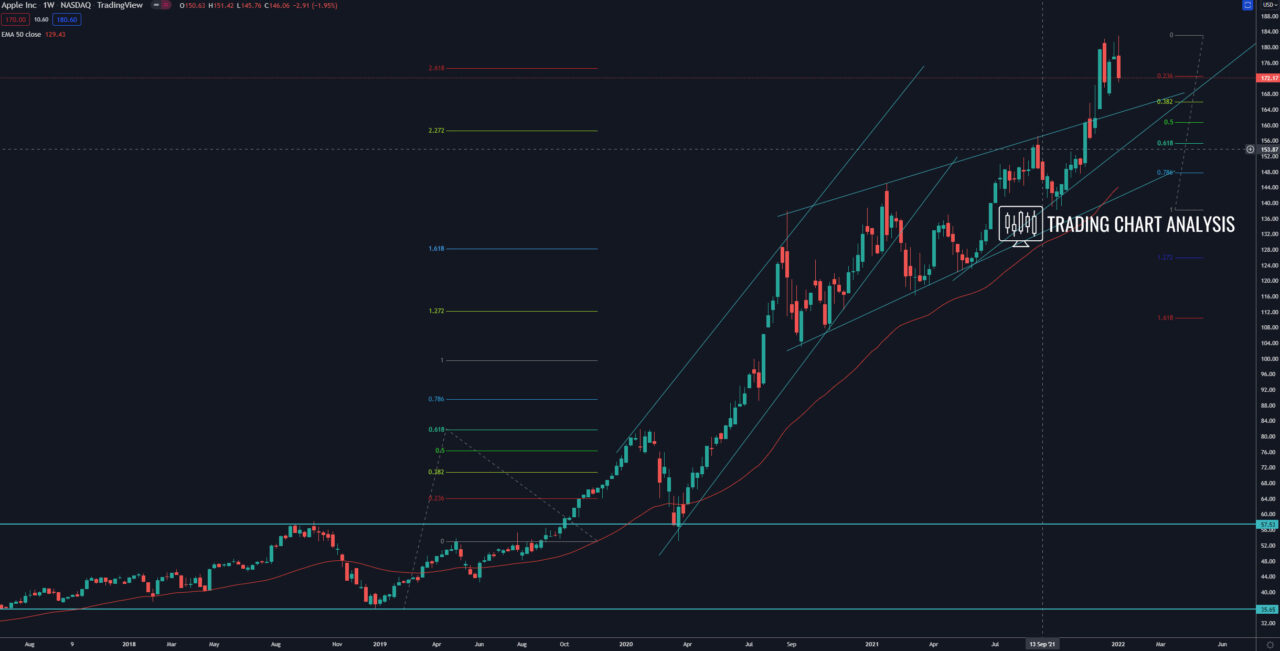
Looking at the weekly chart, we can see the breakout higher, which occurred in December 2021. That confirms the bullish outlook. Now the shares of Apple are in a pullback on the weekly chart. The first target of the pullback is the 0.382 FIB retracement at 165$. And in case the stock of Apple breaks below the 0.382 FIB retracement that will open the door for a decline toward the 0.618 FIB retracement at 155$.
Weekly chart:

Quarterly chart:


