|
Getting your Trinity Audio player ready...
|
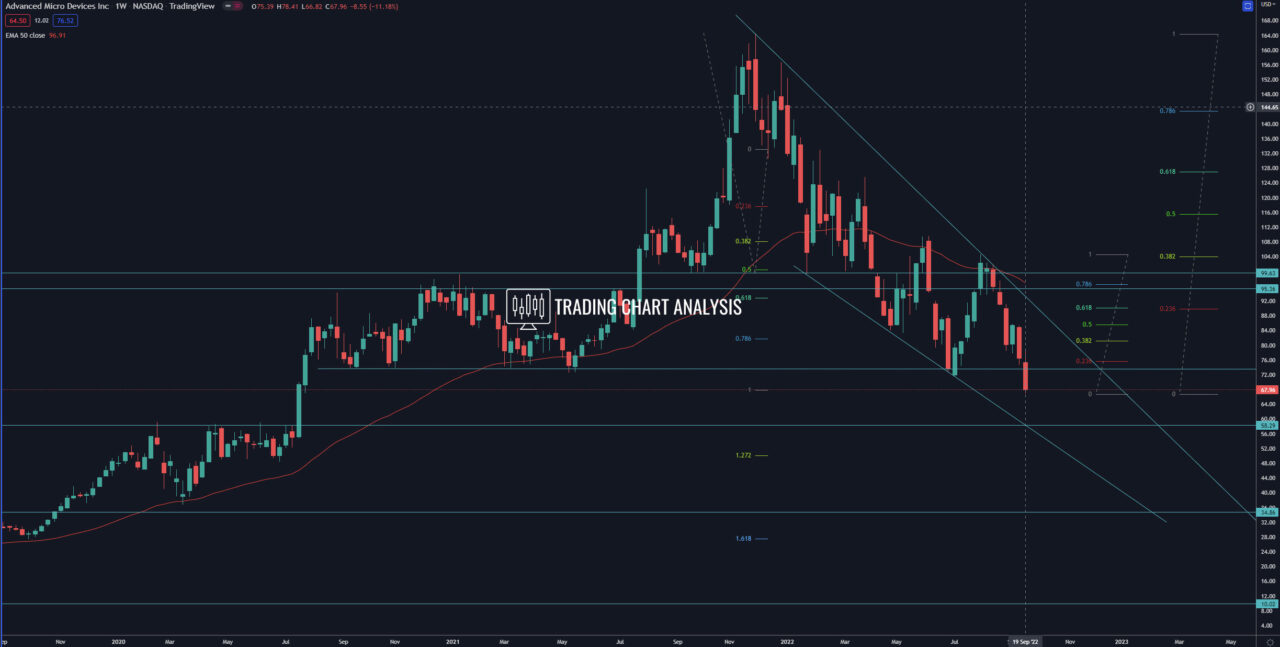
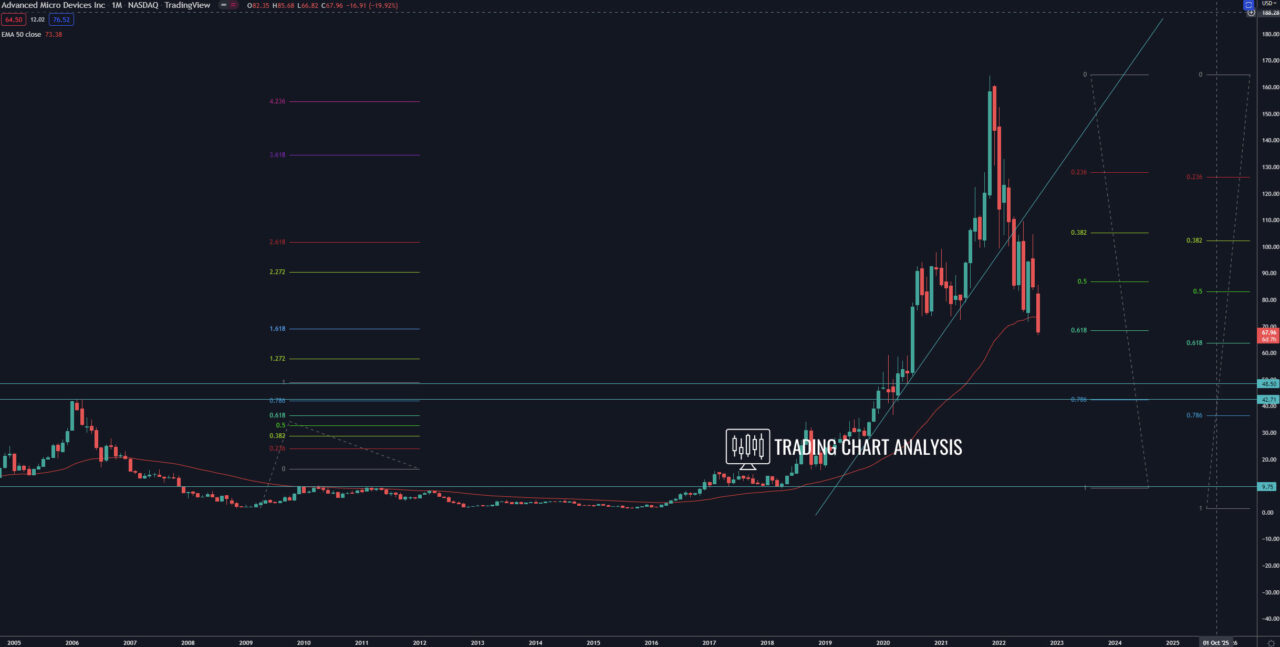
Technical analysis for AMD, the price of the shares of AMD reached the third target of the bearish run on the monthly chart, the 0.618 FIB retracement at 68.50$. On the daily chart, the price of the shares of AMD reached the fourth target of the bearish wave, the 2.618 FIB extension at 68.00$. Next target for the bears of AMD is the 1.272 FIB extension on the weekly chart at 50.00$, which is the first target for the bearish wave on the weekly chart. The second target for the bearish wave on the weekly chart is the 1.618 FIB extension at 27.50$. Before that, we have the 0.786 FIB retracement on the monthly chart and support zone between 36.00-42.00$.
On the upside, in case of a bounce in the price of the AMD shares, the resistance levels to watch are the 0.382 FIB retracement on the daily chart at 81.20$. The previous high on the daily chart at 85.65$. The 0.618 FIB retracement on the daily chart at 90.00$ and the resistance zone between 100.00-105.00$.
Weekly chart:

Monthly chart:


