|
Getting your Trinity Audio player ready...
|
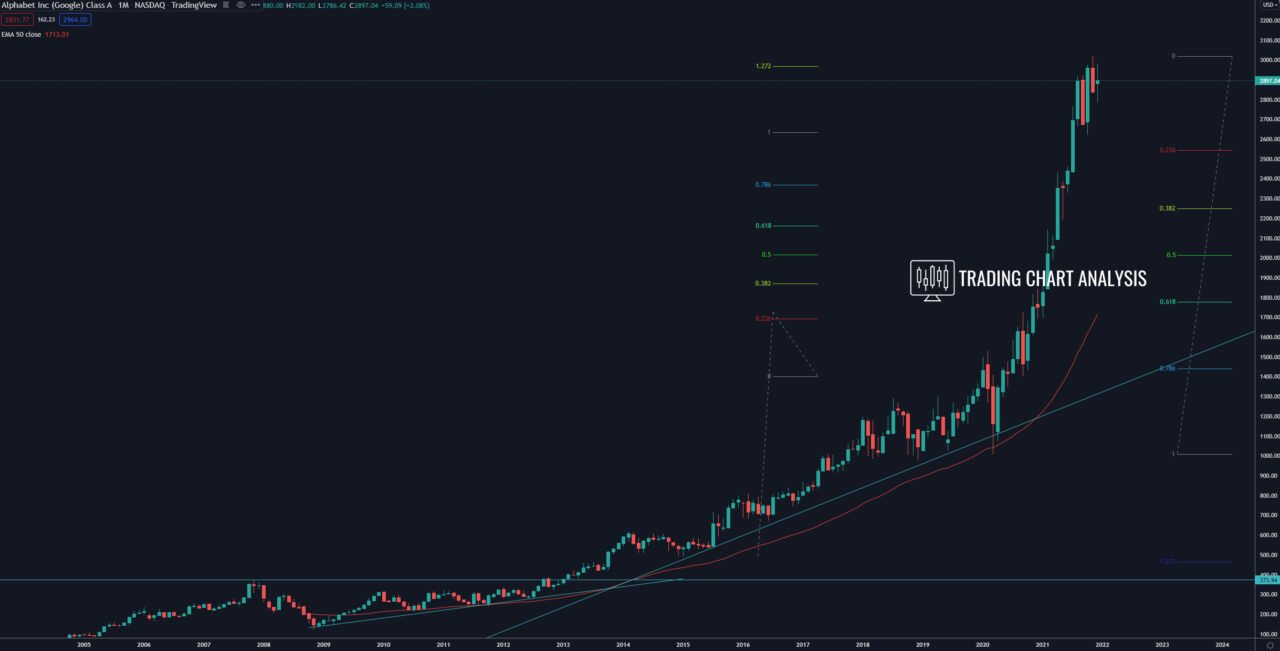
Technical analysis for Alphabet (Google), the shares reached the third target of the fifth bullish wave on the monthly chart, the 1.272 FIB extension at 2965$. The stock of Google went as high as 3019$. A break above 3019$ will extend the fifth bullish wave and send the shares of Google higher toward the 1.618 FIB extension at 3400$.
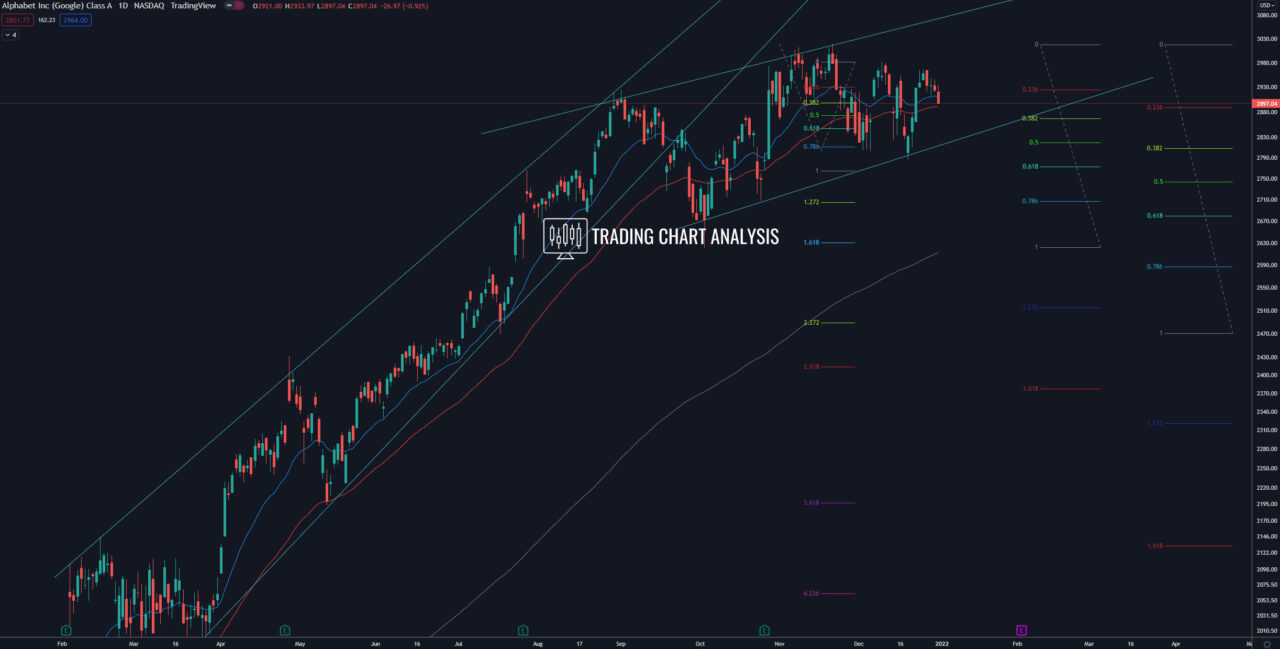
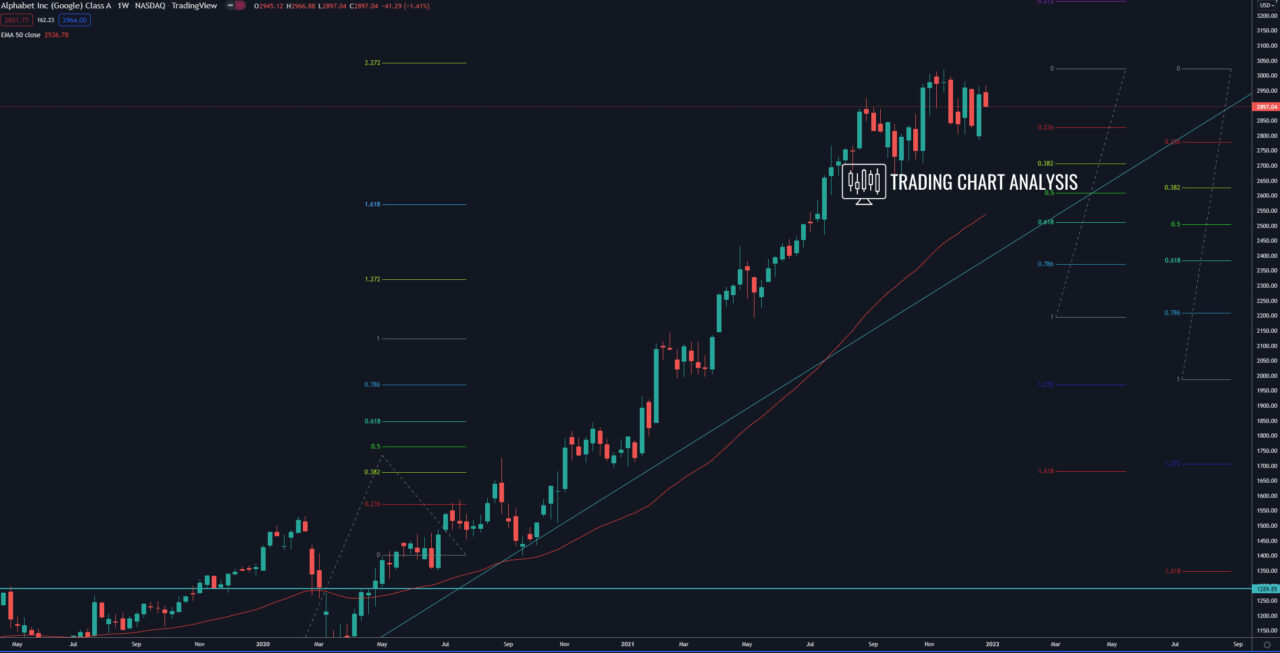
On the daily chart, the shares of Google broke out of ascending price channel, and the price is forming a bearish flag. If the stock of Google breaks below the low at 2786$ on the daily chart, that will start a pullback. The first target of this potential pullback is the 1.272 FIB extension on the daily chart at 2705$, which is also the 0.382 FIB retracement on the weekly chart. The second target is the 1.618 FIB extension on the daily chart at 2630$, which is a weekly low too. The third target is the 0.618 FIB retracement on the weekly chart at 2510$. And if the stock of Google breaks below the 0.618 FIB retracement at 2510$, that will open the door for a bearish run toward the 0.382 FIB retracement on the monthly chart at 2250$.
Daily chart:

Weekly chart:

Monthly chart:


