|
Getting your Trinity Audio player ready...
|
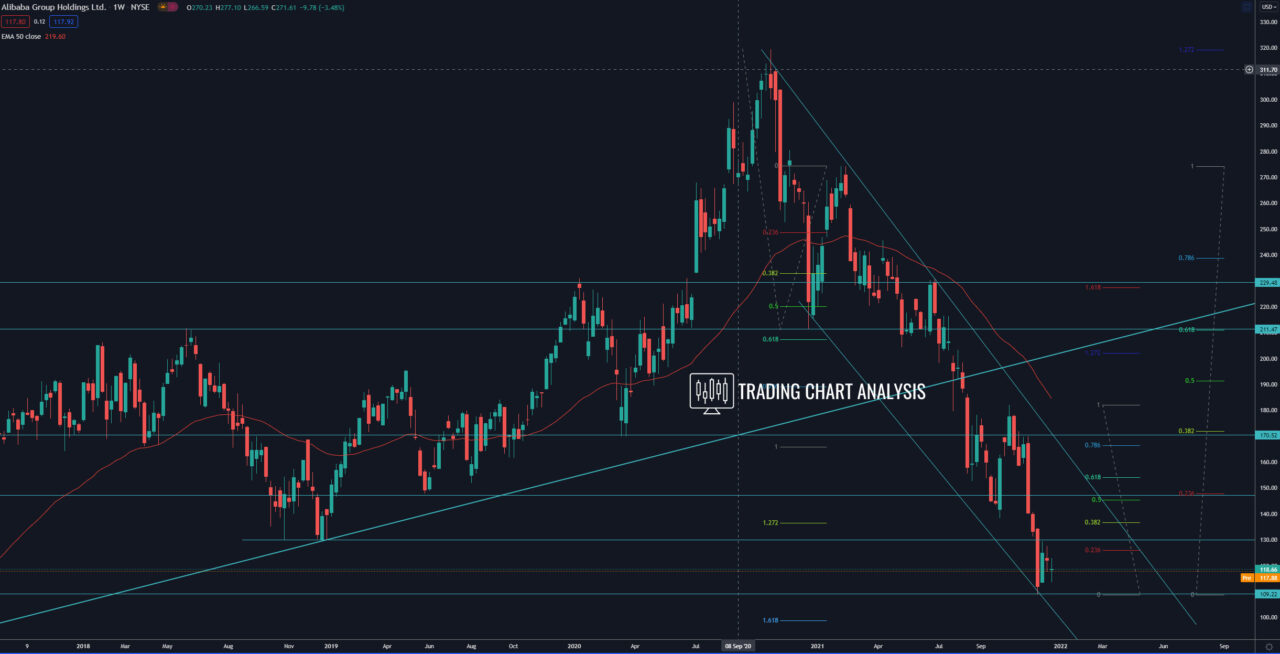
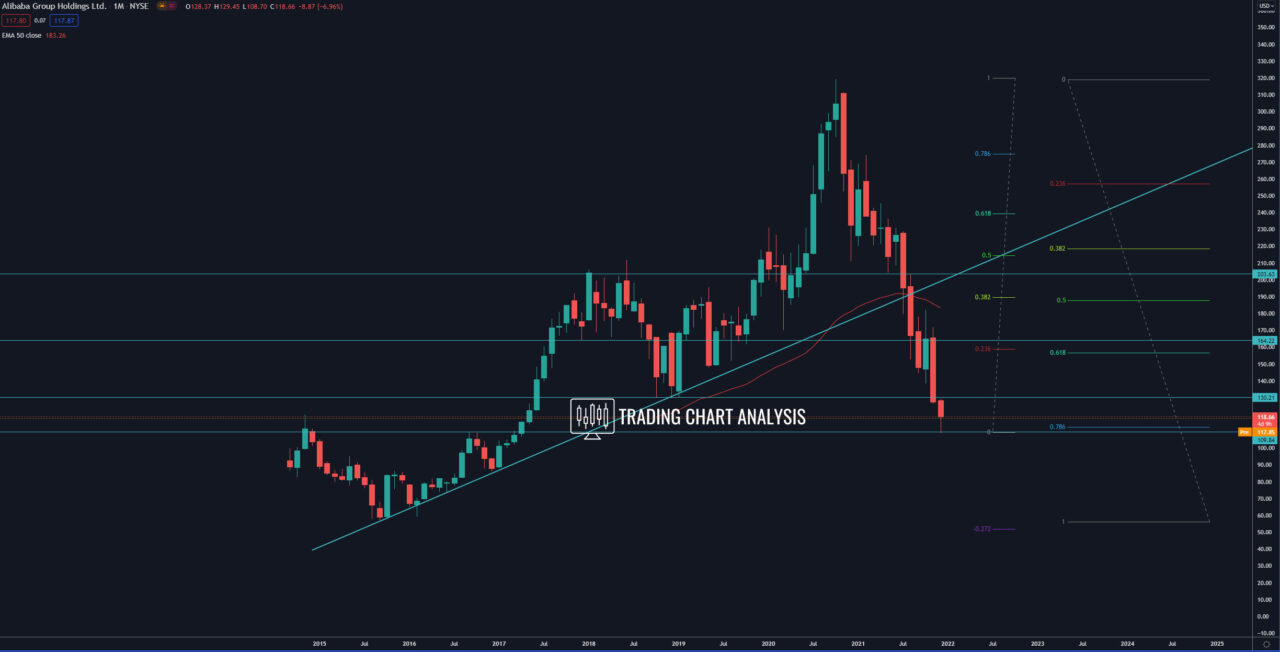
Technical analysis for Alibaba, the shares reached the first target of the weekly bearish wave, the 1.272 FIB extension at 135$. The second target for the bearish wave is the 1.618 FIB extension at 98-100$. However, the shares of Alibaba (BABA) are sitting at the 0.786 FIB retracement on the monthly chart. Also, on the weekly chart, we have bullish divergence for the RSI, Stochastic RSI, and a bit on MACD, which is a signal for bottoming and potential pullback or consolidation.
It is premature to talk about bullish targets because the monthly, weekly, and daily charts are still bearish. However, if the shares of Alibaba (BABA) broke out above the resistance at 130.00, that will open the door for a bullish run. The first target for this potential bullish run is the 0.382 FIB retracement on the weekly chart at 137$. The second target is the 0.618 FIB retracement on the weekly chart at 154$. The third target is the resistance zone at 170$ and eventually the high at 182.09$
Weekly chart:

Monthly chart:


