|
Getting your Trinity Audio player ready...
|
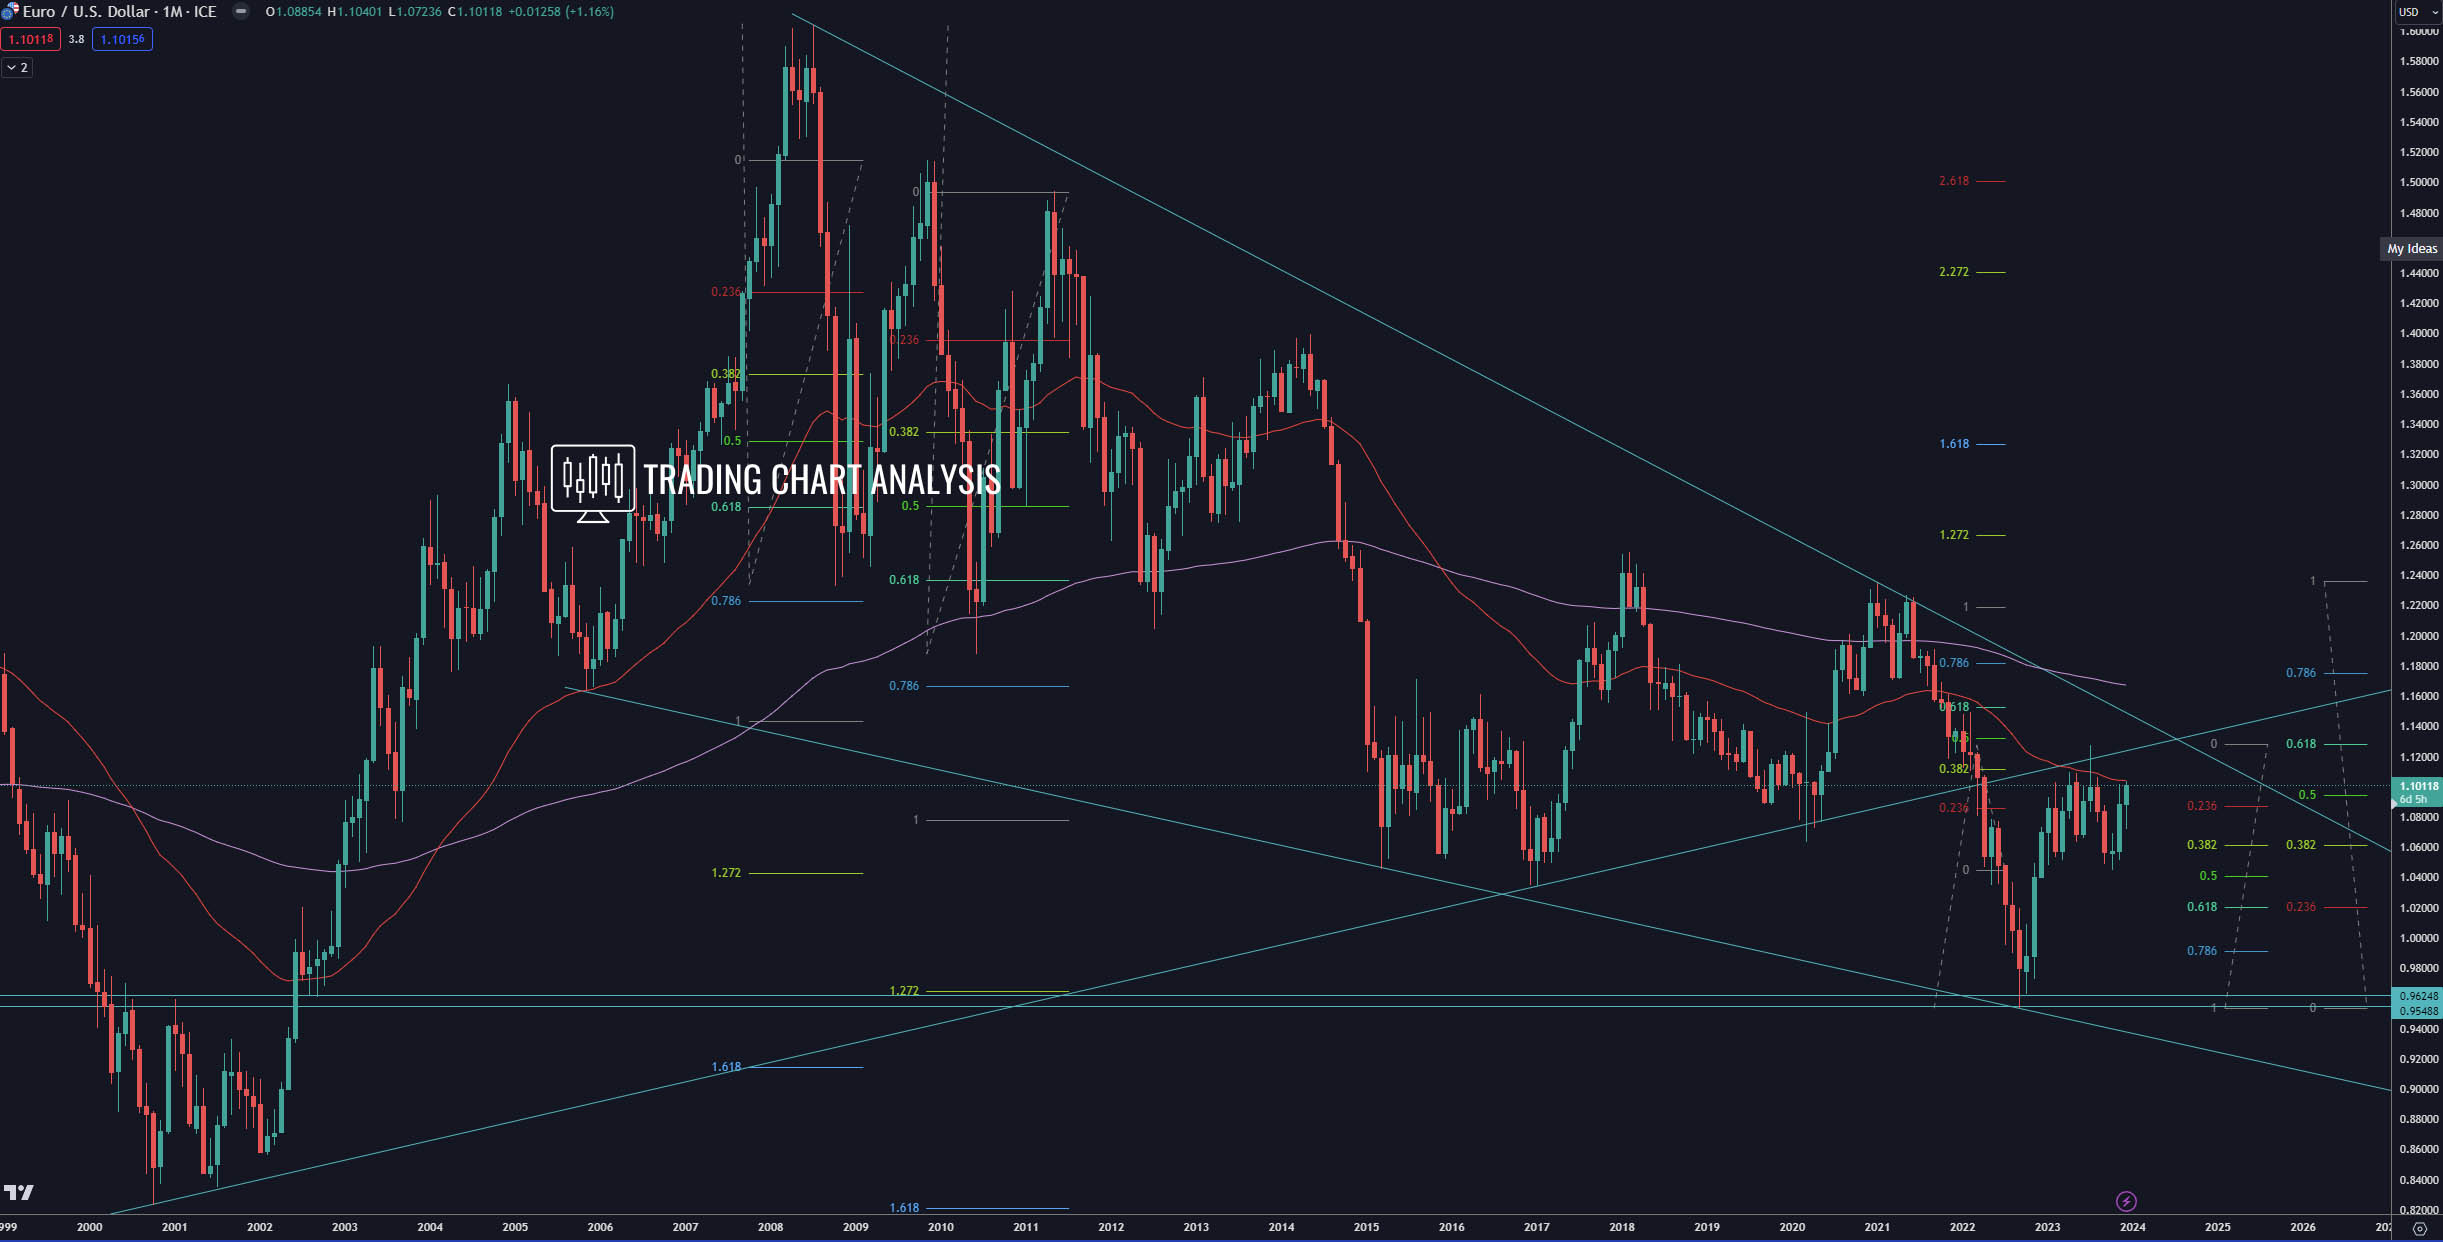
In our EUR/USD technical analysis, a pivotal moment unfolds as the pair rejects the 0.618 Fibonacci retracement with a high-test pattern on the monthly chart. Navigating through the long-term trend reveals a compelling narrative of bearish momentum and potential future targets.
Bearish Momentum: Monthly Chart Insights
- Primary Bearish Target: 1.272 FIB Extension (Monthly) – 1.0420 Examining the monthly chart within the broader bearish trend, the first target emerges at the 1.272 Fibonacci extension, positioned around 1.0420, a milestone achieved in December 2016.
- Secondary Bearish Target: 1.618 FIB Extension (Monthly) – 0.9150 The second target aligns with the 1.618 Fibonacci extension, positioned at 0.9150. These targets encapsulate the trajectory of the third bearish wave within the weekly bearish trend.
- Pullback and Rejection: 0.618 FIB Retracement (Monthly) – 1.1280 Following the September 2022 low at 0.9535 (which matches 1.272 FIB extension on the monthly chart), a pullback materialized, reaching the 0.618 Fibonacci retracement on the monthly chart at 1.1280. This level was, however, rejected with a high-test candle, indicating a pivotal point in market dynamics.
Potential Bullish Scenario: Breaking Resistance
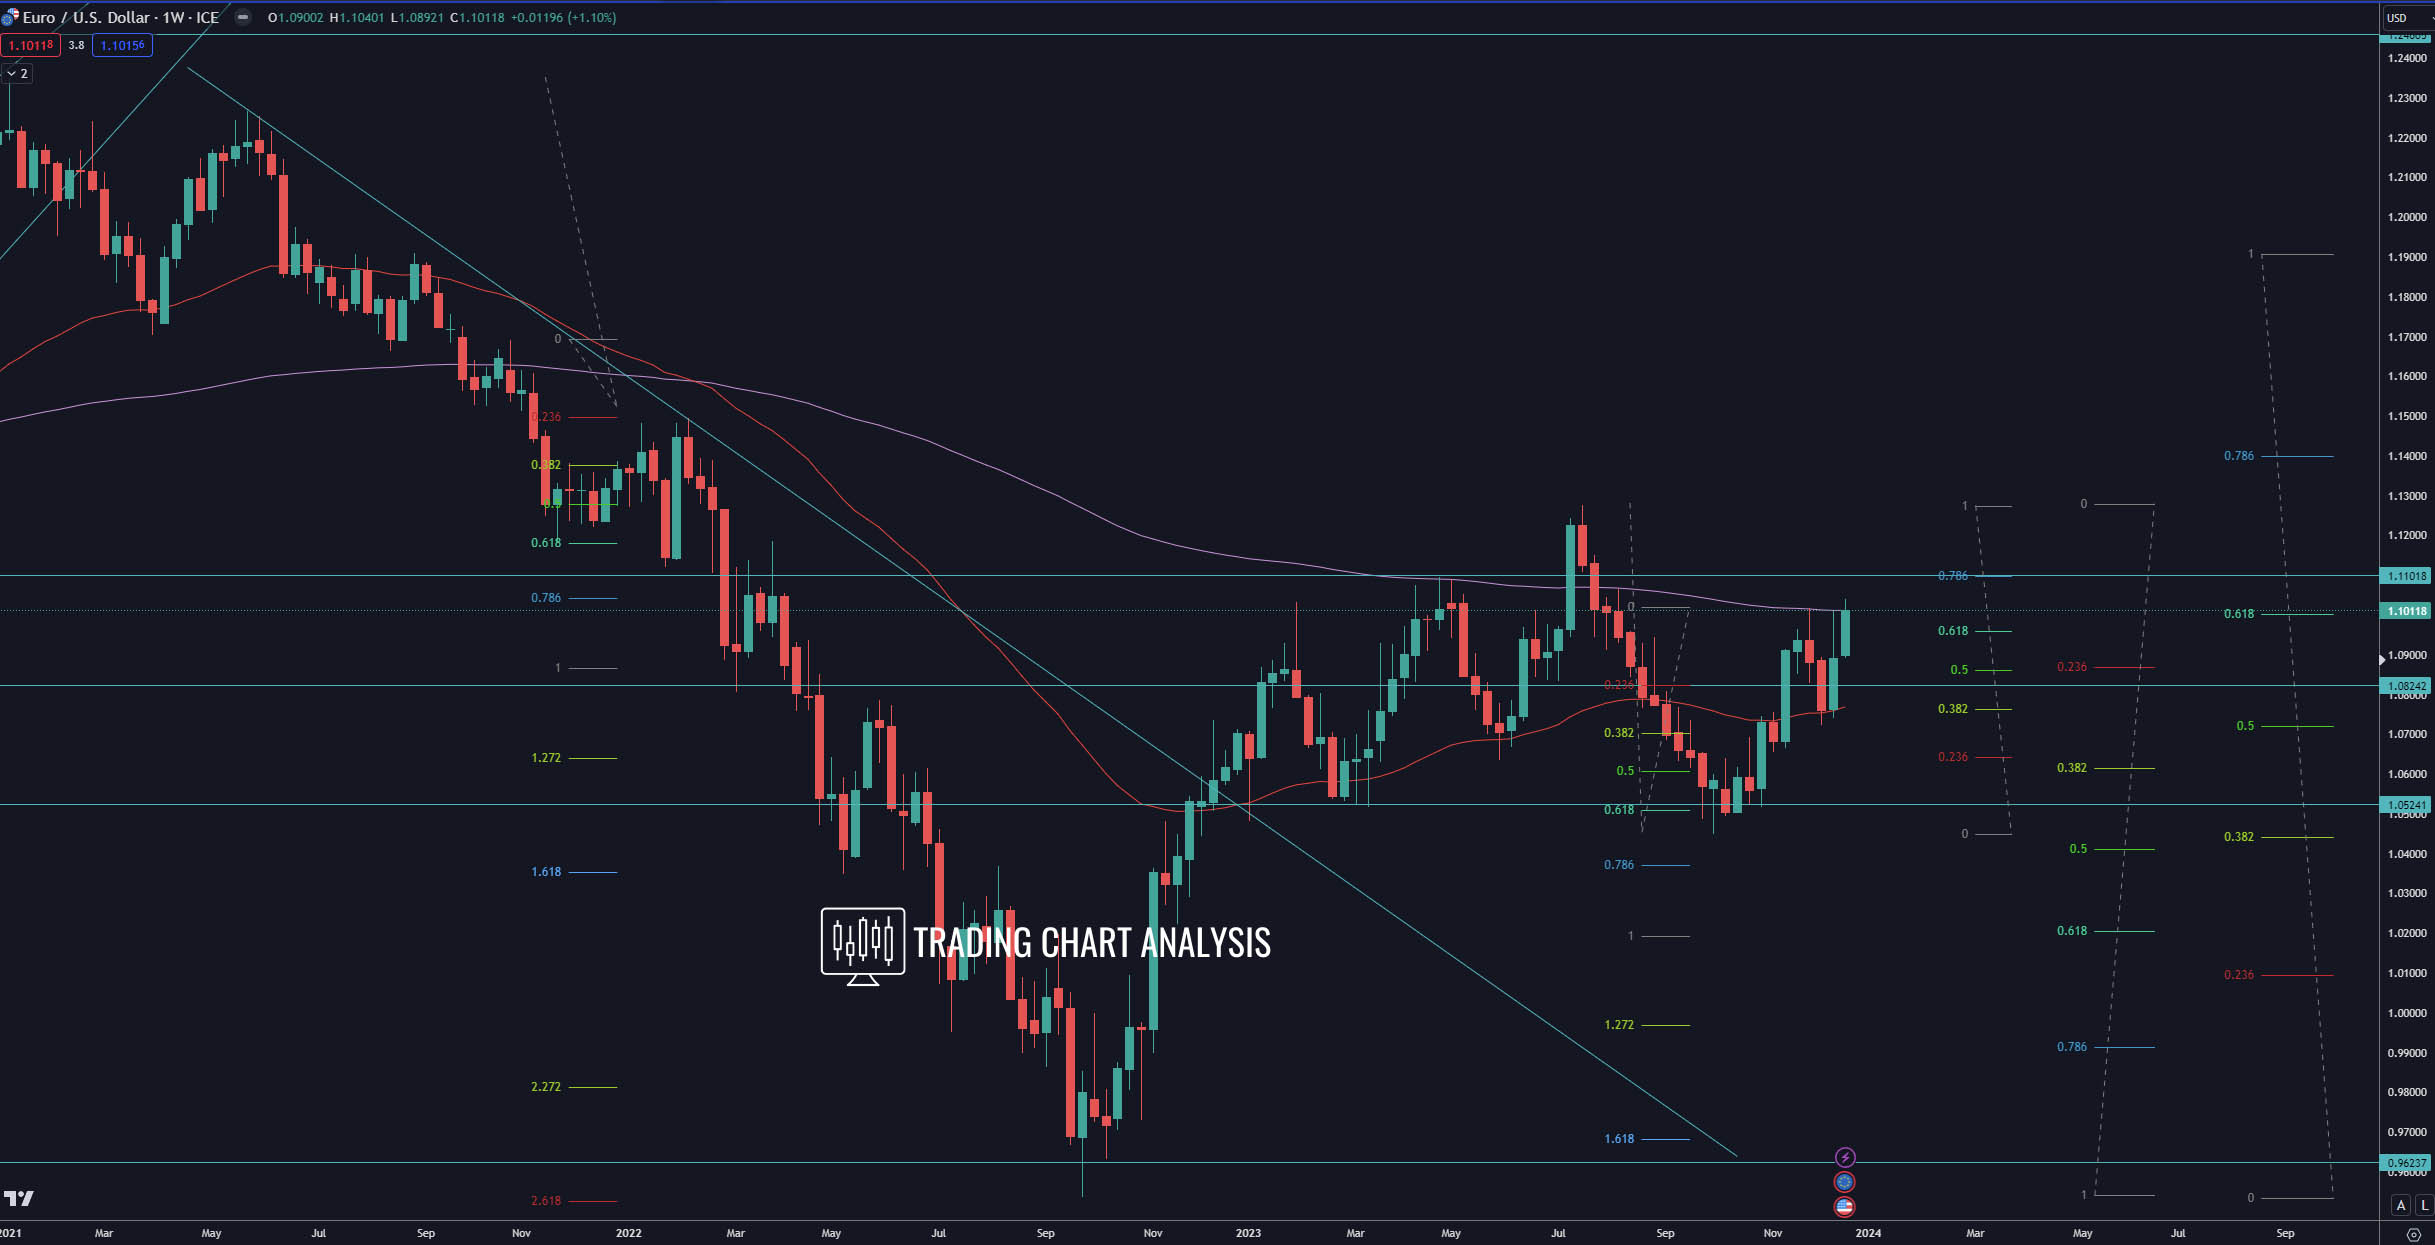
- Bullish Signal: Break Above Previous High – 1.1275 (Weekly/Monthly) A break above the previous high on both the weekly and monthly charts at 1.1275 signals potential bullish momentum. The first target in such a scenario is the 0.618 Fibonacci extension on the monthly chart around 1.1525.
- Subsequent Bullish Targets: 0.786 FIB Retracement (Monthly) – 1.1750 & Monthly High – 1.2349 Continuing the bullish run, the second target is the 0.786 Fibonacci retracement on the monthly chart at 1.1750. The third target lies at the monthly high of 1.2349, situated within a critical resistance zone.
Bearish Signals: Head & Shoulders on Weekly Chart
- Bearish Pattern: Head & Shoulders Formation (Weekly) On the weekly chart, the EUR/USD forms a bearish Head & Shoulders pattern, indicating potential bearish implications.
- Bearish Targets: Break Below Low – 1.0723 (Daily/Weekly) & Previous Weekly Low – 1.0448 A break below the low at 1.0723 on both daily and weekly charts initiates a decline toward the previous weekly low at 1.0448. Subsequent targets include the 0.618 Fibonacci retracement at 1.0200 and the 1.272 Fibonacci extension at 0.9970. The third target is the 1.618 Fibonacci extension on the weekly chart at 0.9680.
As we navigate the complexities of the EUR/USD currency pair, these technical insights provide a roadmap for traders to make informed decisions in a dynamic and evolving market landscape.
Weekly chart:

Monthly chart:


