|
Getting your Trinity Audio player ready...
|
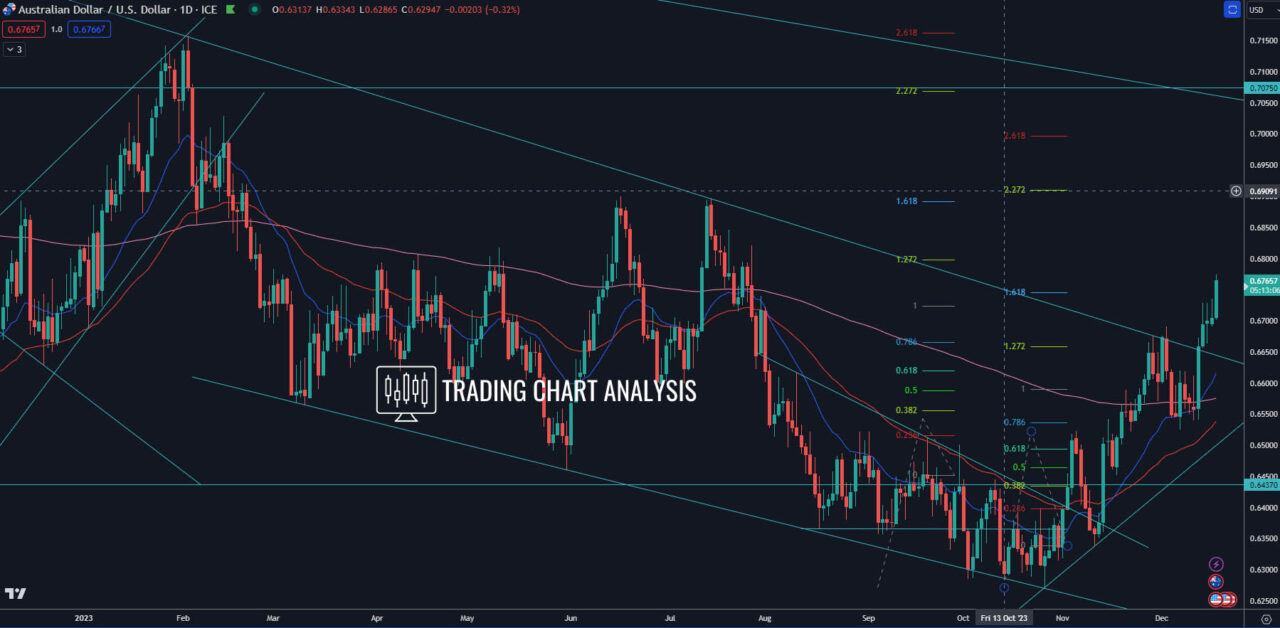
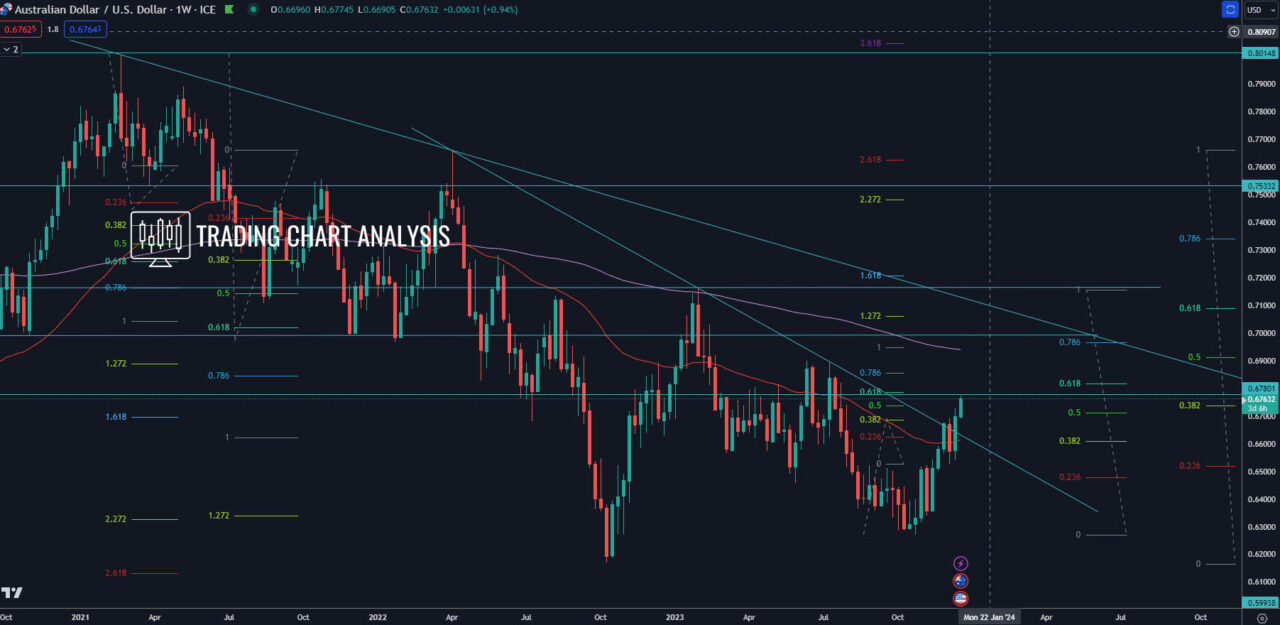
In the dynamic realm of currency trading, the AUD/USD pair has recently undergone a noteworthy shift, breaking free from the constraints of a descending channel on the daily chart and surpassing a crucial descending trend line on the weekly chart. This pivotal move has ignited a bullish momentum, paving the way for a fascinating journey that demands the attention of astute traders.
Bullish Targets: Riding the Ascending Wave
- Primary Objective: 0.6820 (0.618 FIB Retracement, Weekly) The initial target for this bullish surge is set at 0.6820, strategically positioned at the 0.618 Fibonacci retracement level on the weekly chart.
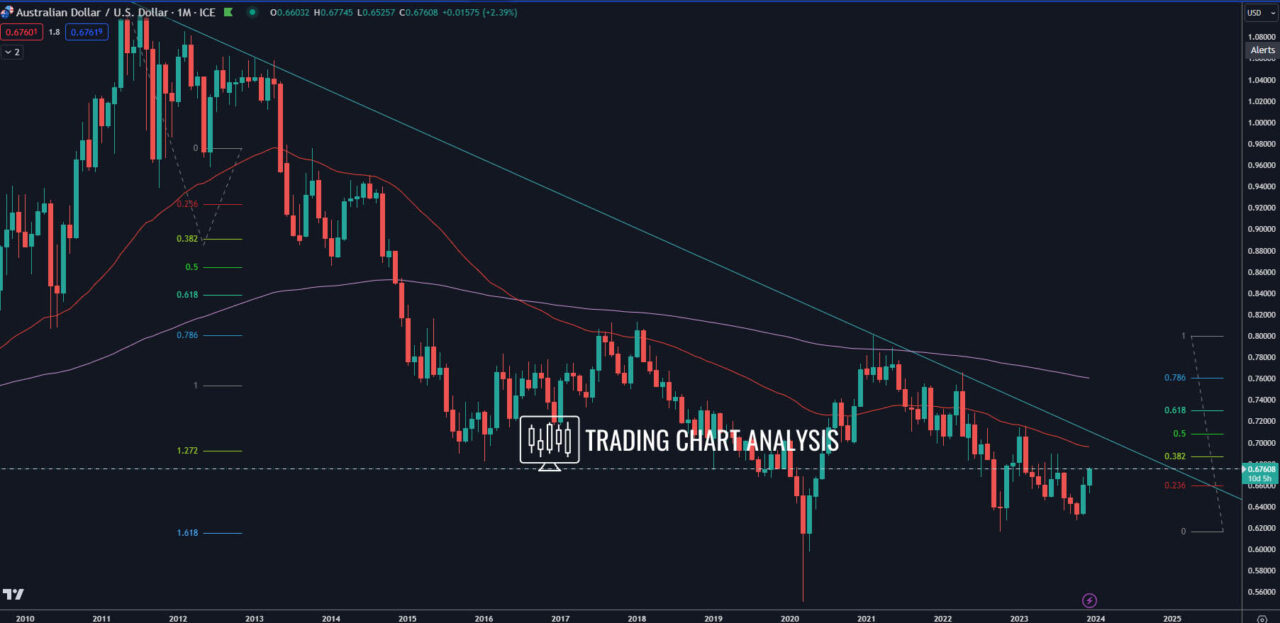
- Secondary Aspiration: 0.7065 (1.272 FIB Extension, Weekly) Progressing further, the focus shifts to the 1.272 Fibonacci extension on the weekly chart, situated at 0.7065, a level just below the 0.500 Fibonacci retracement on the monthly chart at 0.7090.
- Tertiary Destination: 0.7205 (1.618 FIB Extension, Weekly) and 0.7300 (0.618 FIB Retracement, Monthly) The journey continues with the third target at 0.7205, marked by the 1.618 Fibonacci extension on the weekly chart. Beyond lies the enticing territory of 0.7300, encompassing the 0.618 Fibonacci retracement on the monthly chart.
- Final Frontier: 0.7480-0.7620 (2.272-2.618 FIB Extension, Weekly) with a Glimpse of 0.786 FIB Retracement on Monthly The ultimate objective materializes between the 2.272 and 2.618 Fibonacci extensions on the weekly chart, spanning from 0.7480 to 0.7620. Intriguingly, within this zone lies the 0.786 Fibonacci retracement on the monthly chart, adding an extra layer of significance.
Cautionary Outlook: Navigating Potential Reversals
However, as we navigate this bullish narrative, it’s crucial to remain vigilant. A breach below the daily chart’s low at 0.6525 serves as a warning signal, opening the door to a potential downtrend.
- Initial Retreat: 0.6465-0.6440 Support Zone A dip below 0.6525 could initiate a descent towards the first support zone, ranging between 0.6465 and 0.6440.
- Downward Momentum: 0.6380-0.6330 Support Zone The journey southward intensifies, leading toward the secondary support zone between 0.6380 and 0.6330, setting the stage for a retest of the low at 0.6270.
In conclusion, the AUD/USD pair’s technical landscape unveils a compelling tale of potential prosperity, guided by key Fibonacci levels. Traders should tread cautiously, keeping a watchful eye on critical support and resistance zones, ready to adapt their strategies as the market unfolds.
Daily chart:

Weekly chart:

Monthly chart:


