|
Getting your Trinity Audio player ready...
|
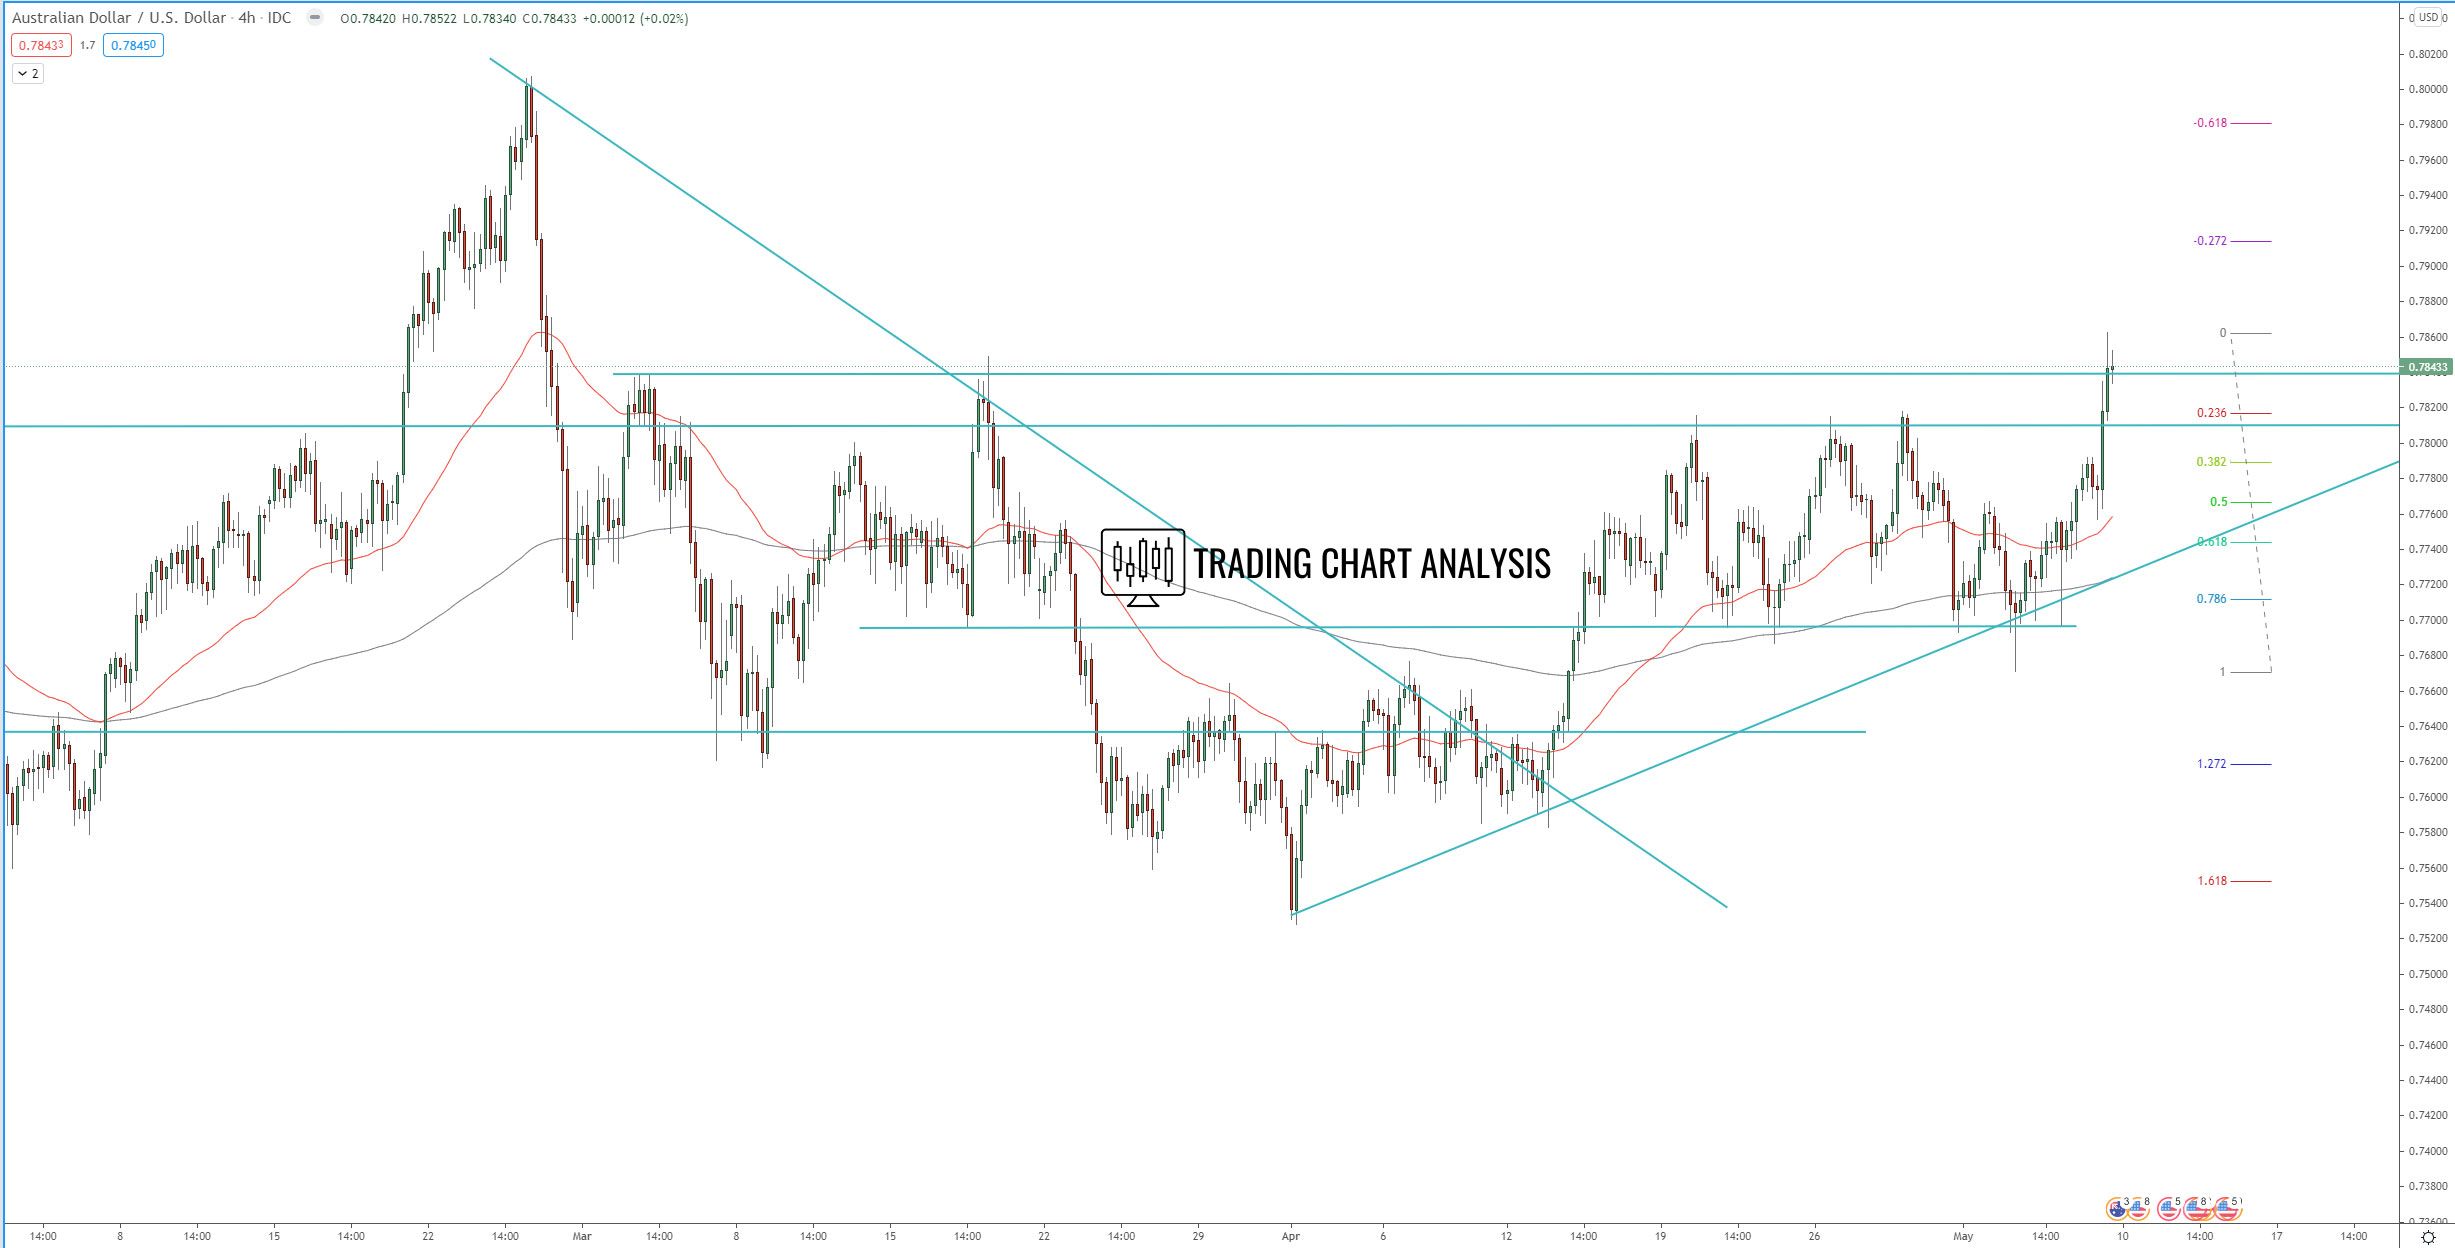
Technical analysis for the AUD/USD pair, the price broke above the range on the 4H chart and the daily chart and closed above the previous weekly and daily closes, an early signal for further upside potential. The first target of this breakout is the previous weekly high at 0.8007, the second target is the 1.618 FIB extension at 0.8140, which is just above the 2018 high at 0.8135.
On the other hand, if the price break below the support zone between 0.7700-0.7675, it will invalidate the bullish outlook, and it will send the AUD/USD pair lower toward the previous weekly low at 0.7535.
4H chart:
Daily chart:

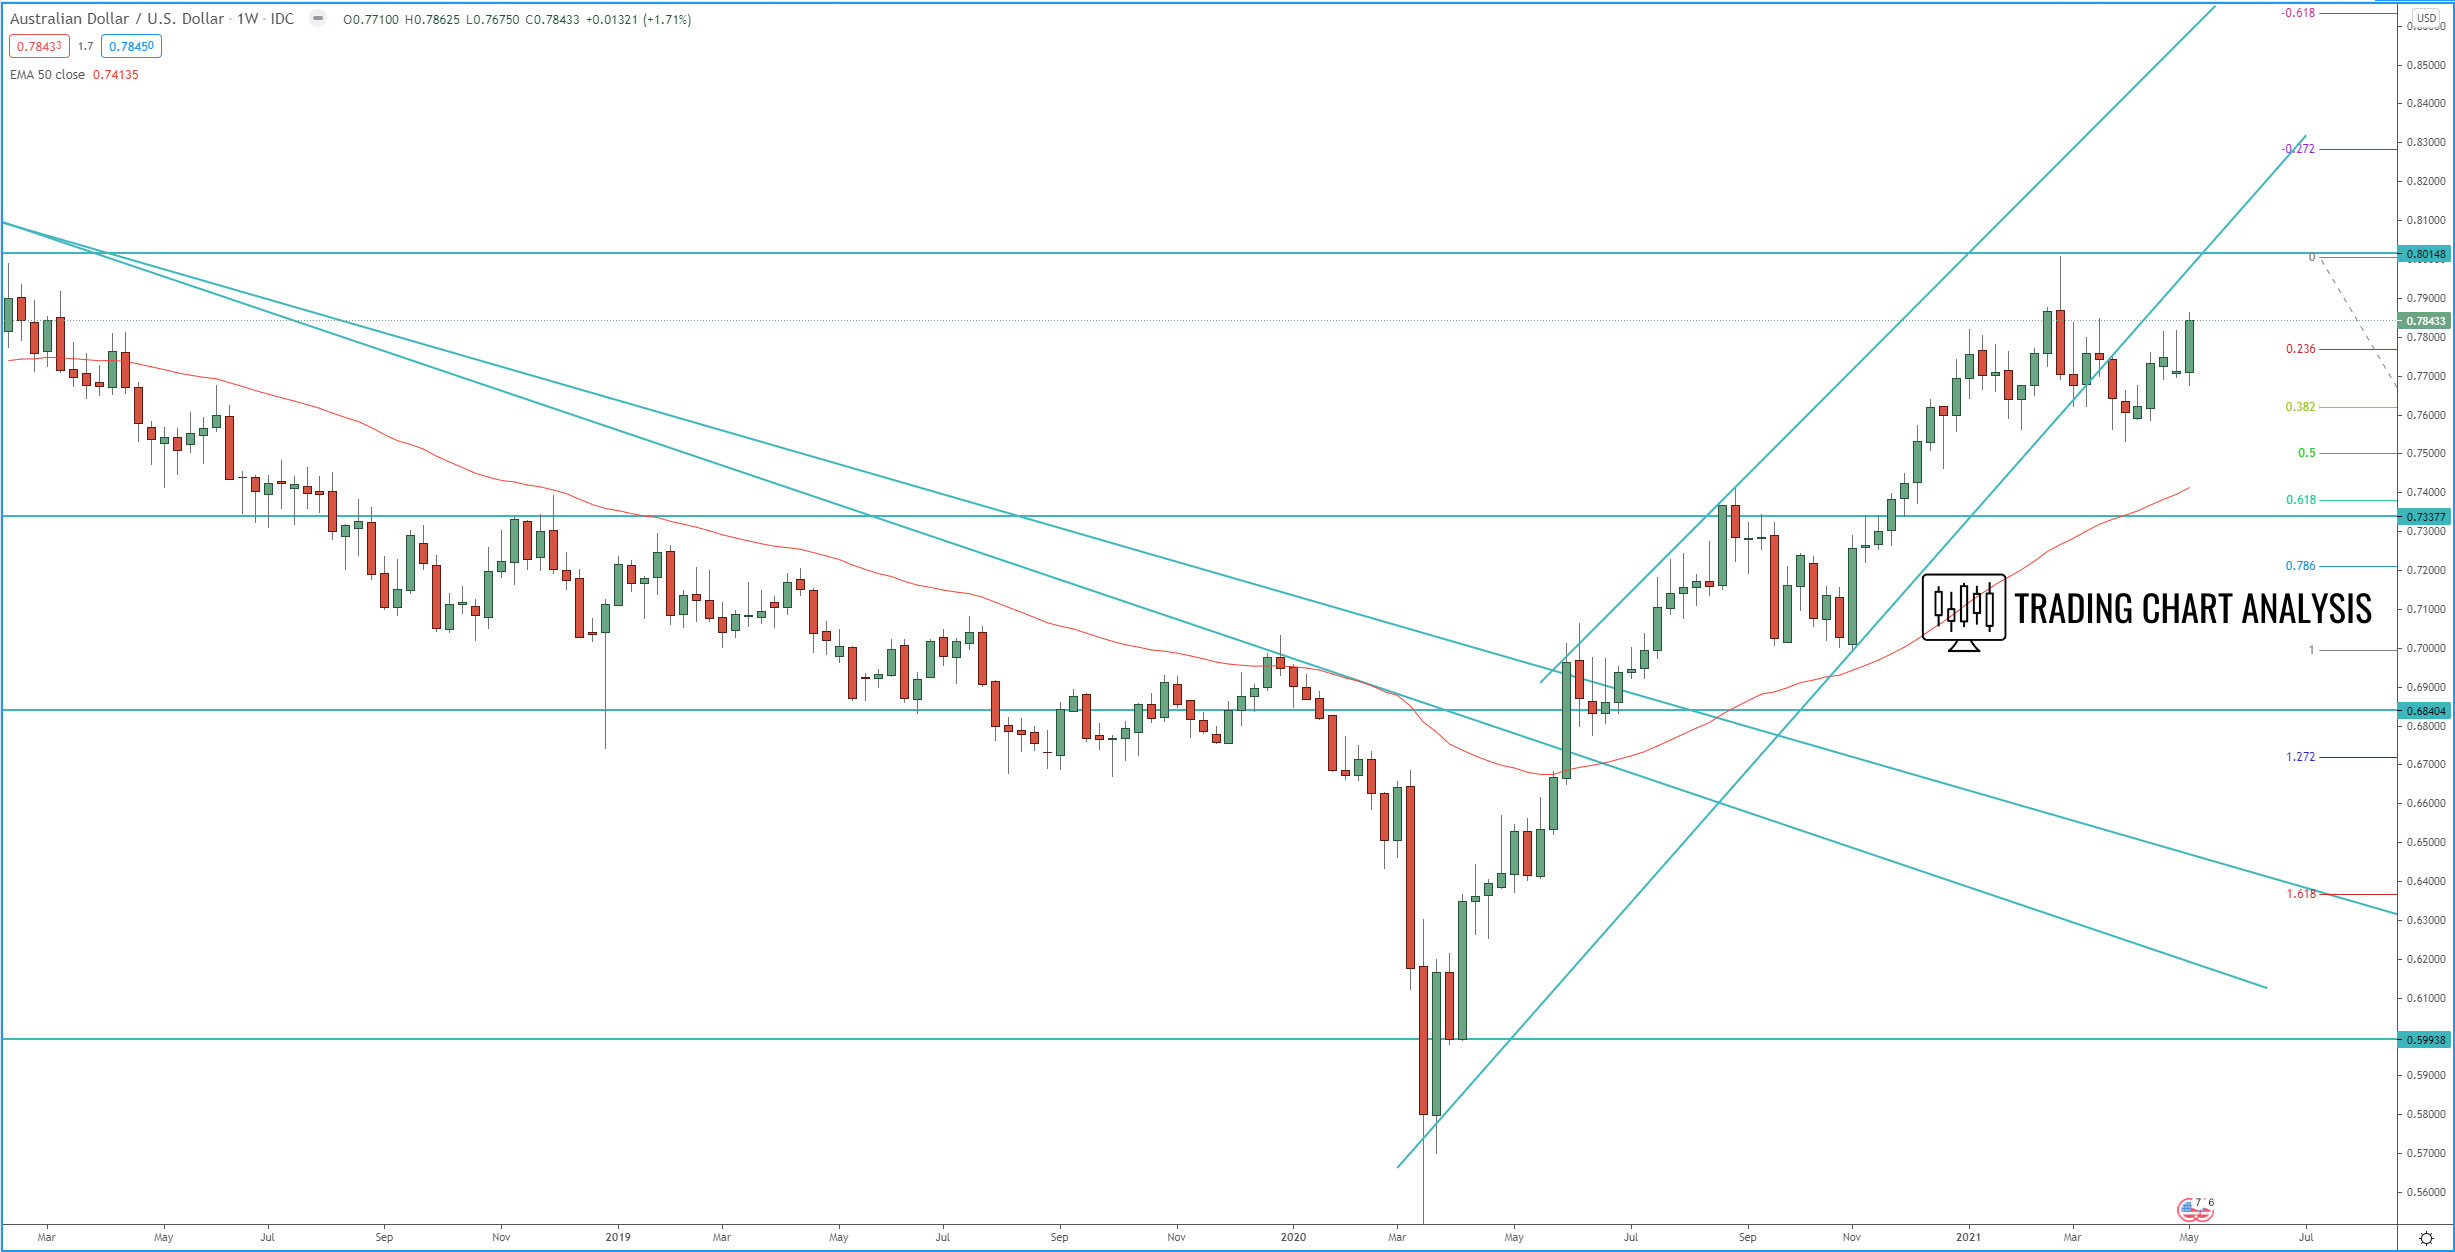
Weekly chart:
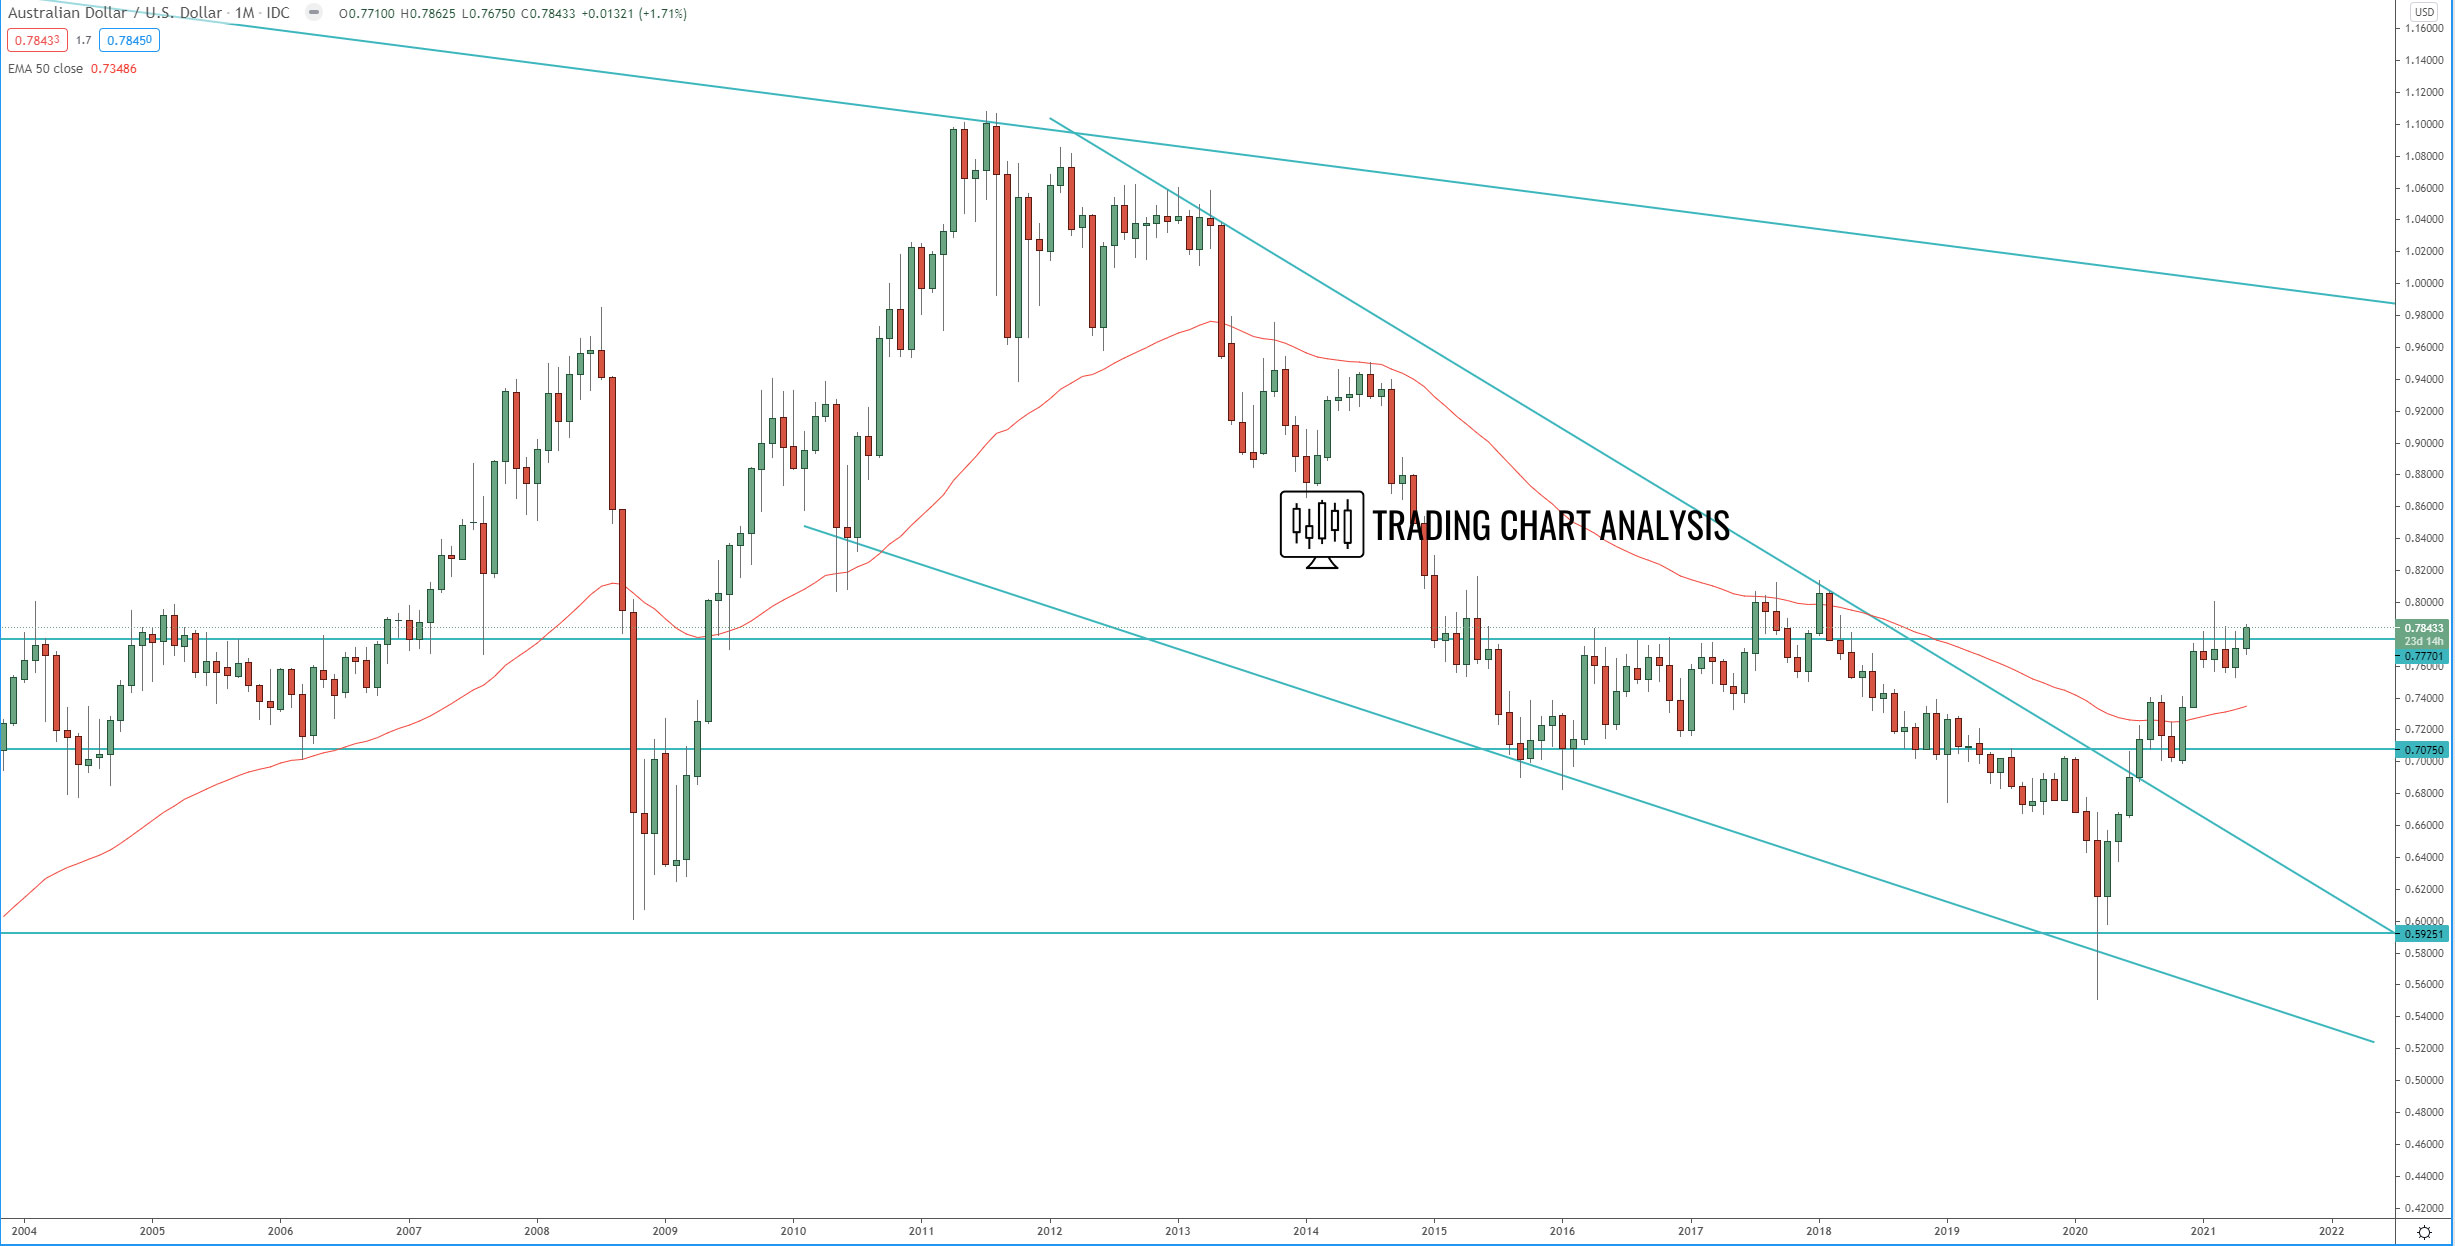
Monthly chart: