|
Getting your Trinity Audio player ready...
|
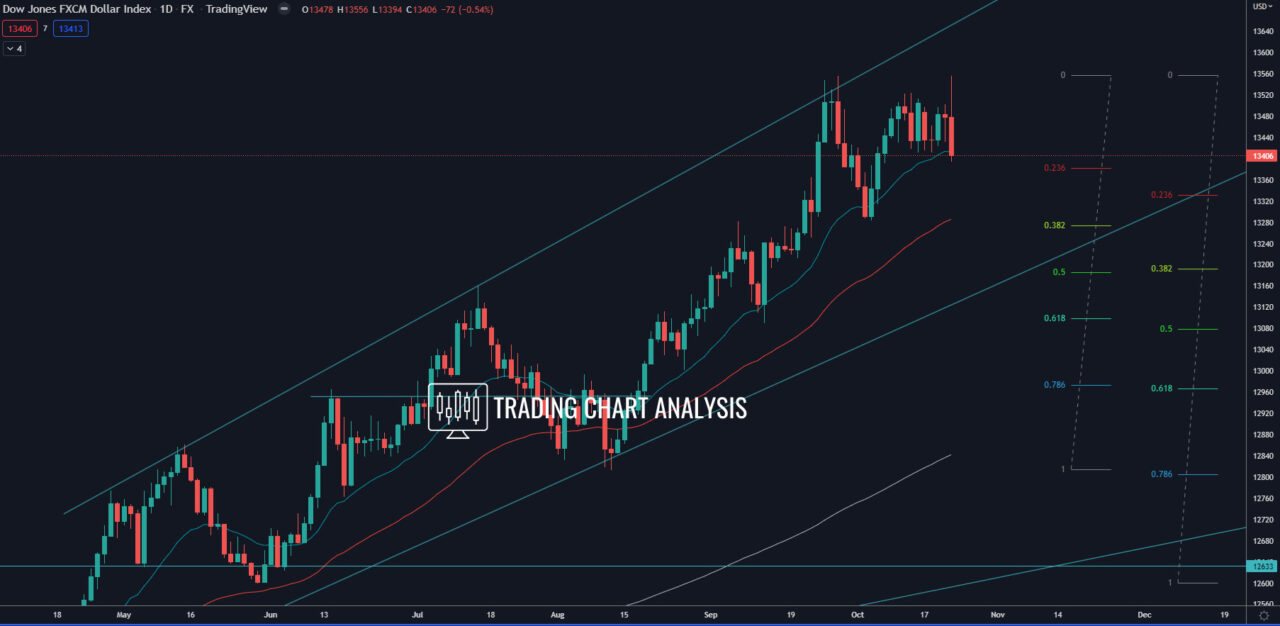
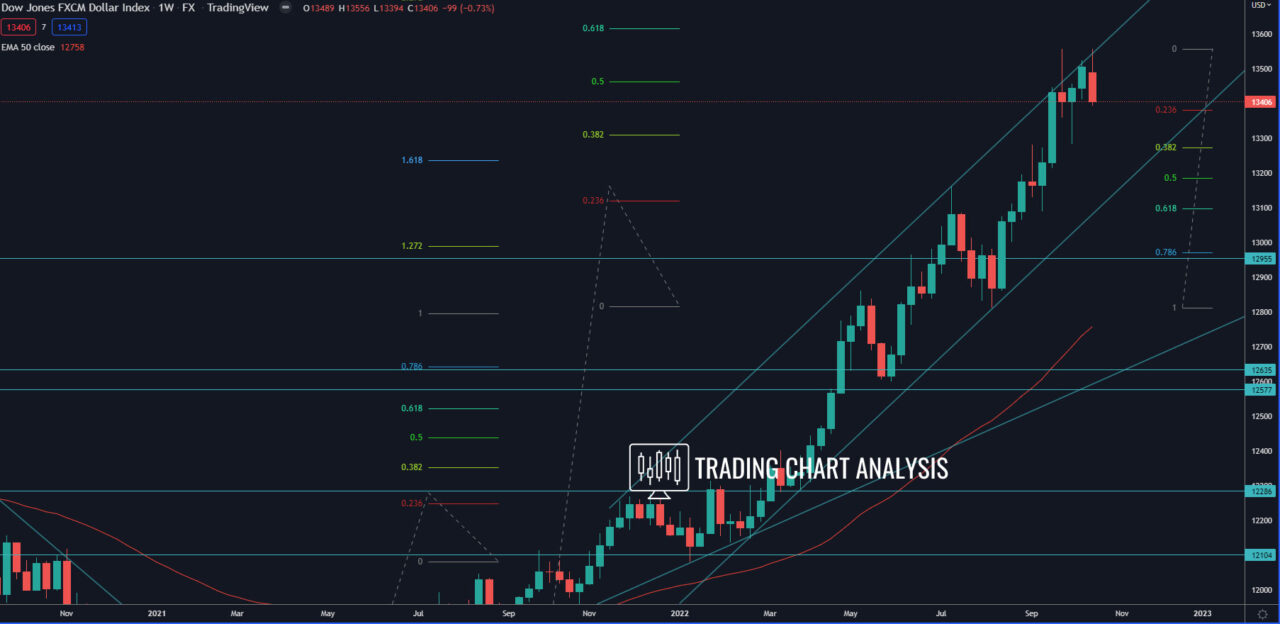
Technical analysis for the FXCM dollar index, the price formed a double-top pattern on the daily chart rejecting the top of ascending price channel on both the daily and the weekly charts, signaling a pullback. The first target for this potential pullback is the previous low on the daily chart at 13 284, which is just above the 0.382 FIB retracement on the weekly chart at 13 270. The second target is the 0.618 FIB retracement on the weekly chart at 13 090, where we have minor support. The third target of the potential pullback in the dollar index is the low on the weekly chart at 12 813. In case of a deeper pullback, the support zone around 12 600 is also an option for the FXCM dollar index.
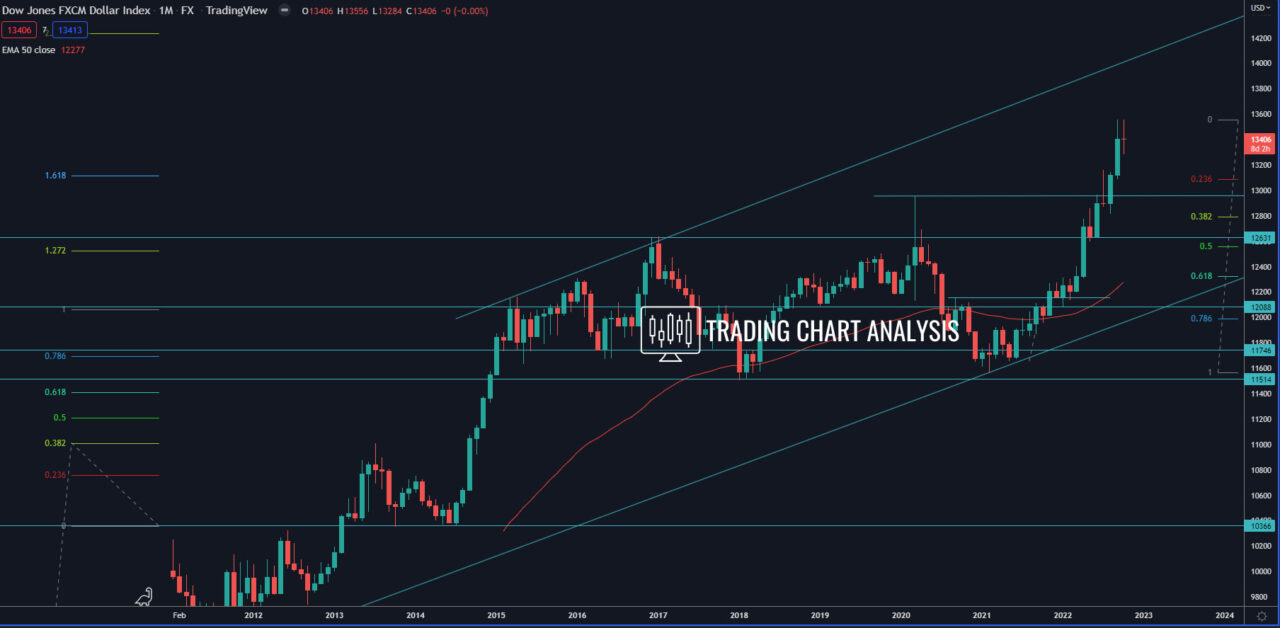
Looking at the bigger picture, the FXCM dollar index is in a bullish wave on the weekly chart, which started in the middle of 2021. Depending on how you count those waves, the index still has room to reach the last target of either the third or the fifth bullish wave, respectively the 2.272 FIB extension at 13 705 or the 0.618 FIB extension at 13 615.
Daily chart:

Weekly chart:

Monthly chart:


