|
Getting your Trinity Audio player ready...
|
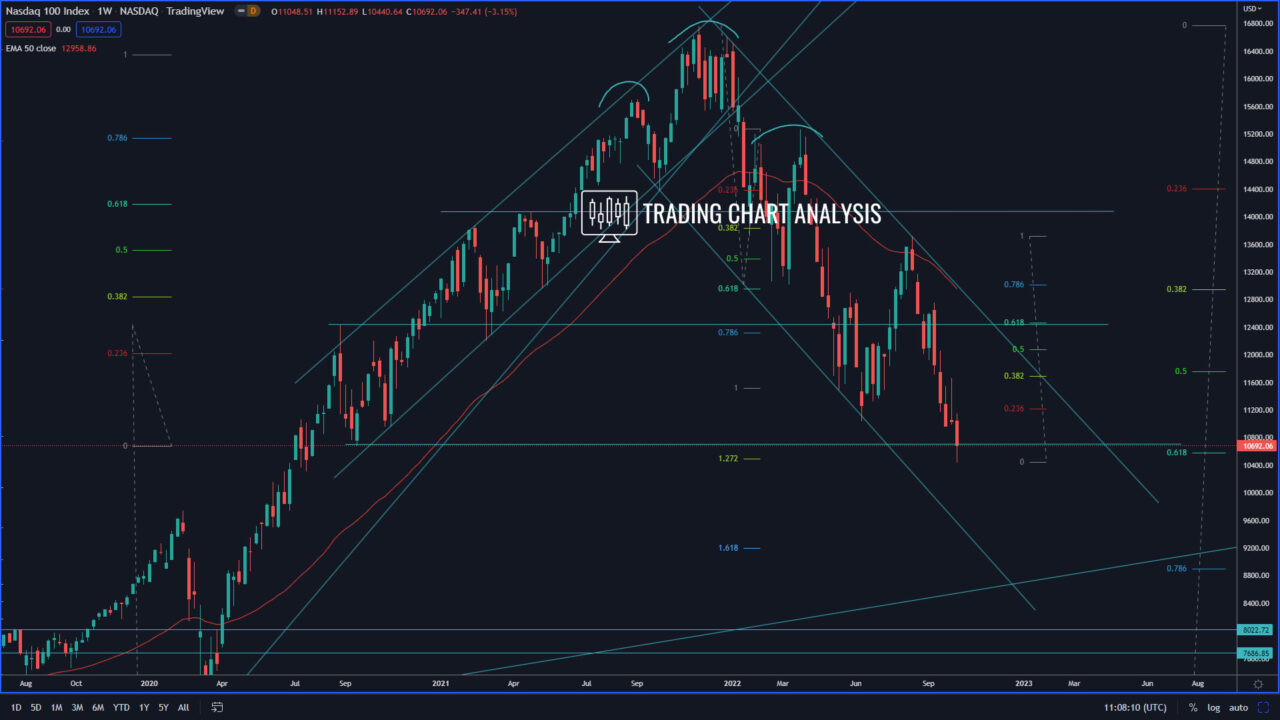
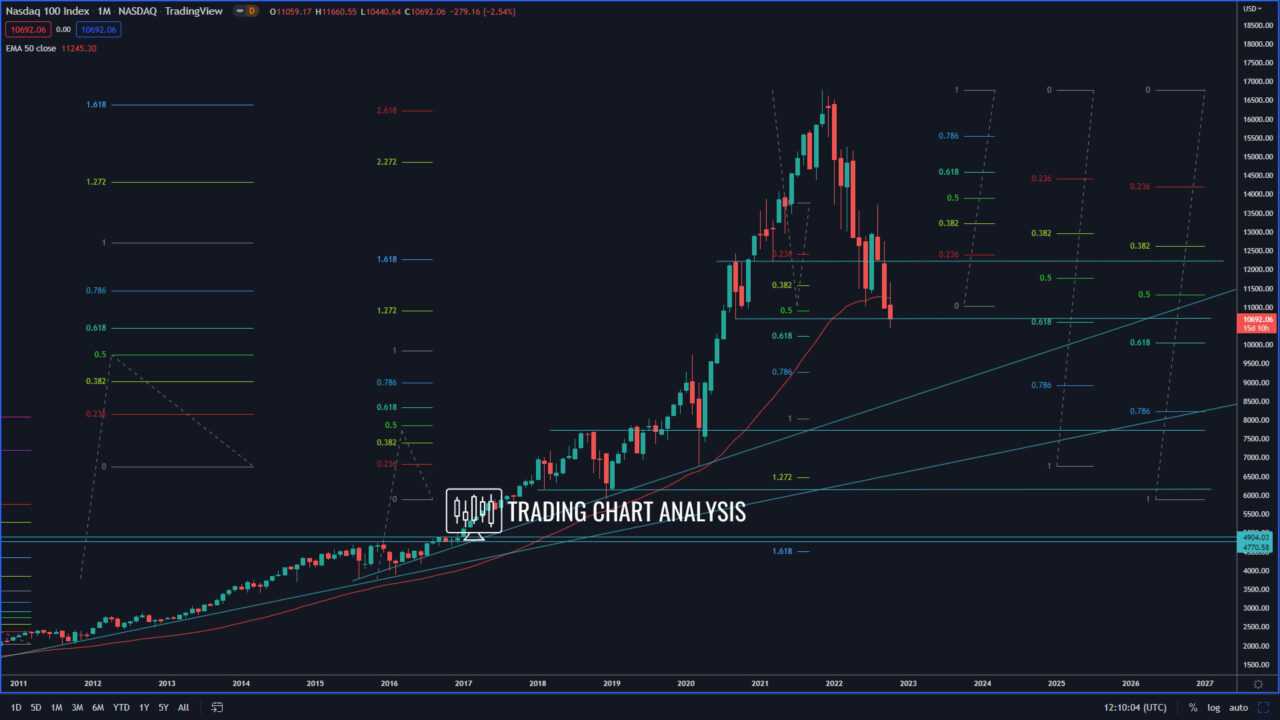
Technical analysis for NASDAQ 100, the index reached the first target of the bearish wave on the weekly chart, the 1.272 FIB extension at 10 500, which is also a 0.618 FIB retracement on the weekly and monthly charts.
If the NASDAQ index starts trading and holding below 10 500, that will open the door for a bearish run toward the second target of the bearish wave, the 1.618 FIB extension on the weekly chart at 9190. The third target of the bearish wave on the weekly chart for NASDAQ is the 2.272 FIB extension at 6740, which is close to the 2020 low for the index.
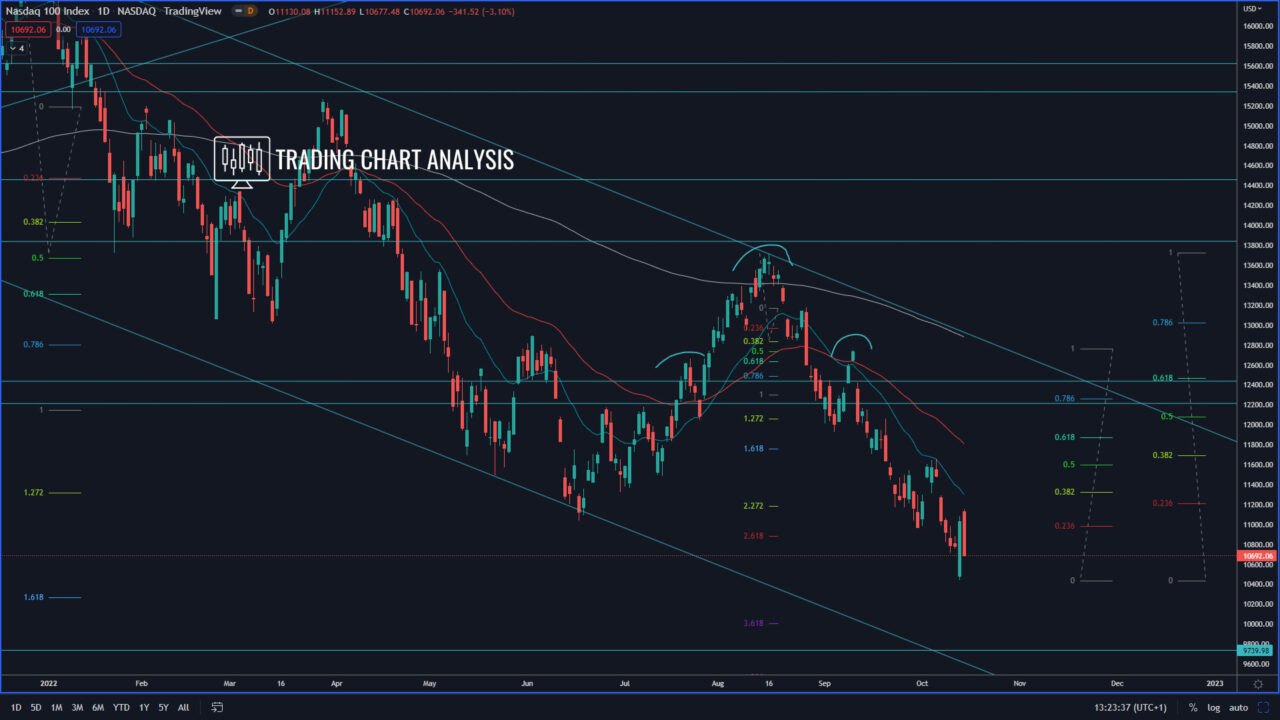
In case of a bounce in the NASDAQ 100, the first target for this potential bounce is the 0.382 FIB retracement on the daily chart at 11 660, which is the previous daily high. The second target is the 0.618 FIB retracement on the daily chart at 12 460, which is a resistance zone. And the third target for the potential bounce in NASDAQ 100 is the previous high on the weekly chart at 13 720.
Daily chart:

Weekly chart:

Monthly chart:


