|
Getting your Trinity Audio player ready...
|
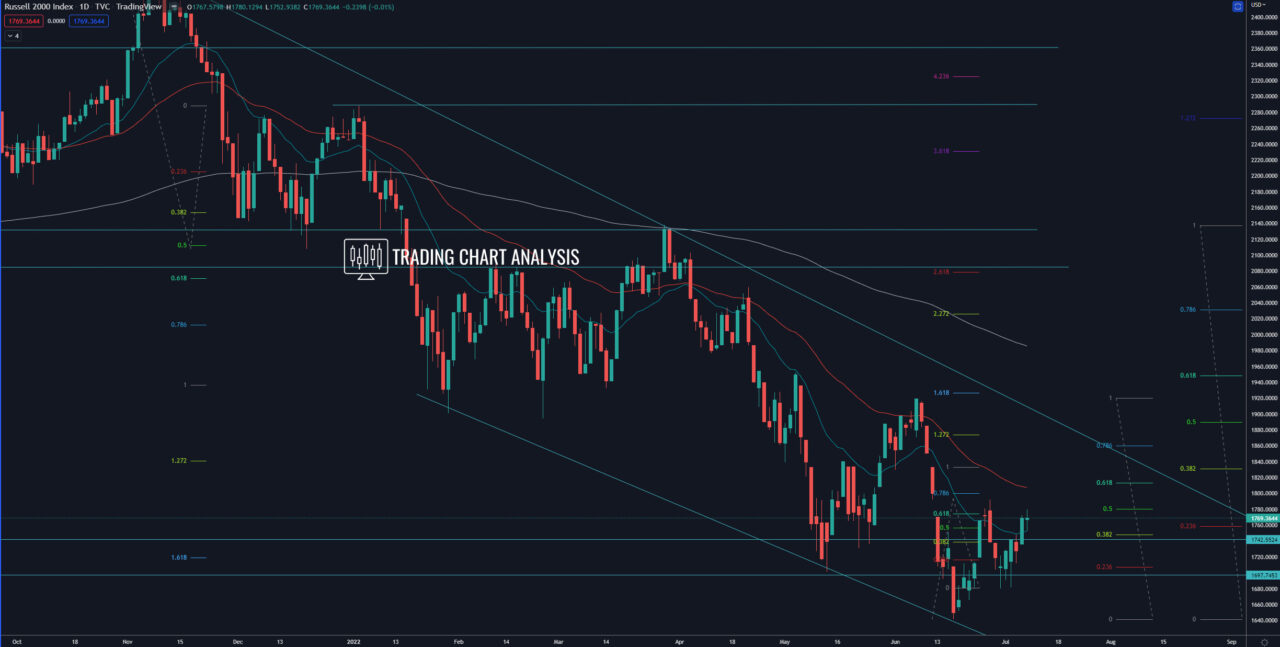
Technical analysis for Russell 2000, the index bounced from a support zone, starting a pullback. The focus is on the previous high on the daily chart at 1792. If the index breaks above that high, it will extend this pullback. The first target for this pullback is the 0.618 FIB retracement on the daily chart at 1815. The second target is the 0.382 FIB retracement on the weekly chart at 1830. The third target is the 1.272 FIB extension on the daily chart at 1875. And the fourth target for the bounce in the index Russell 2000 is the 1.618 FIB extension on the daily chart at 1925.
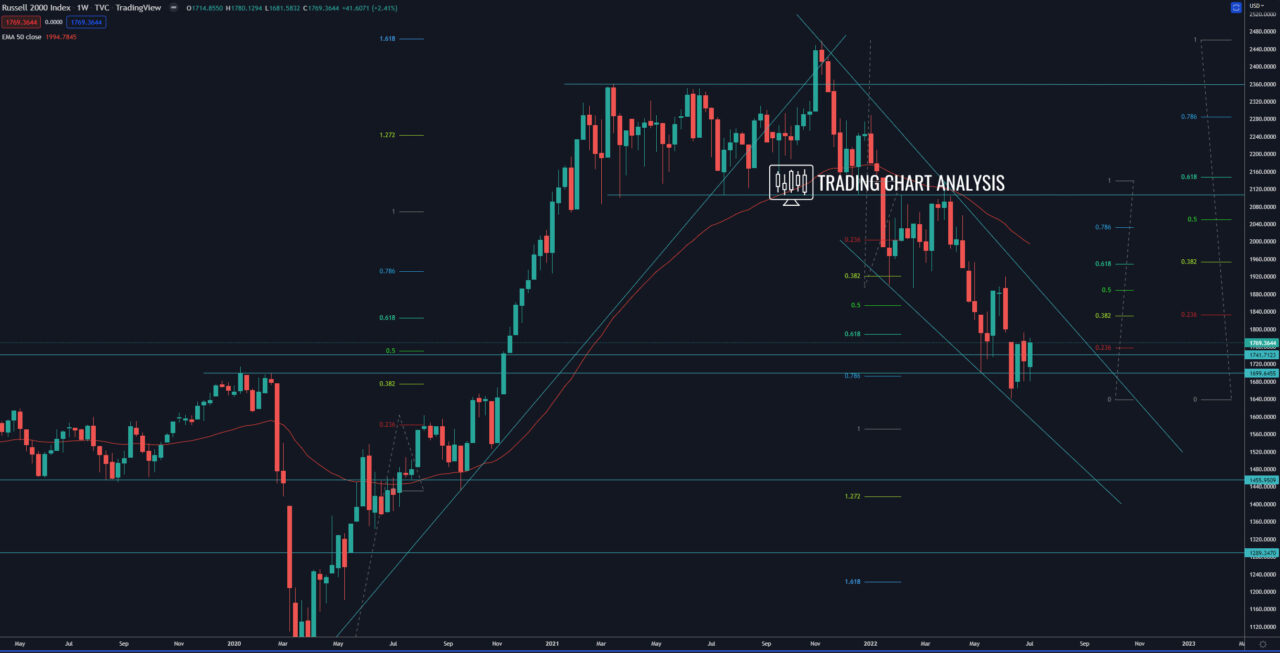
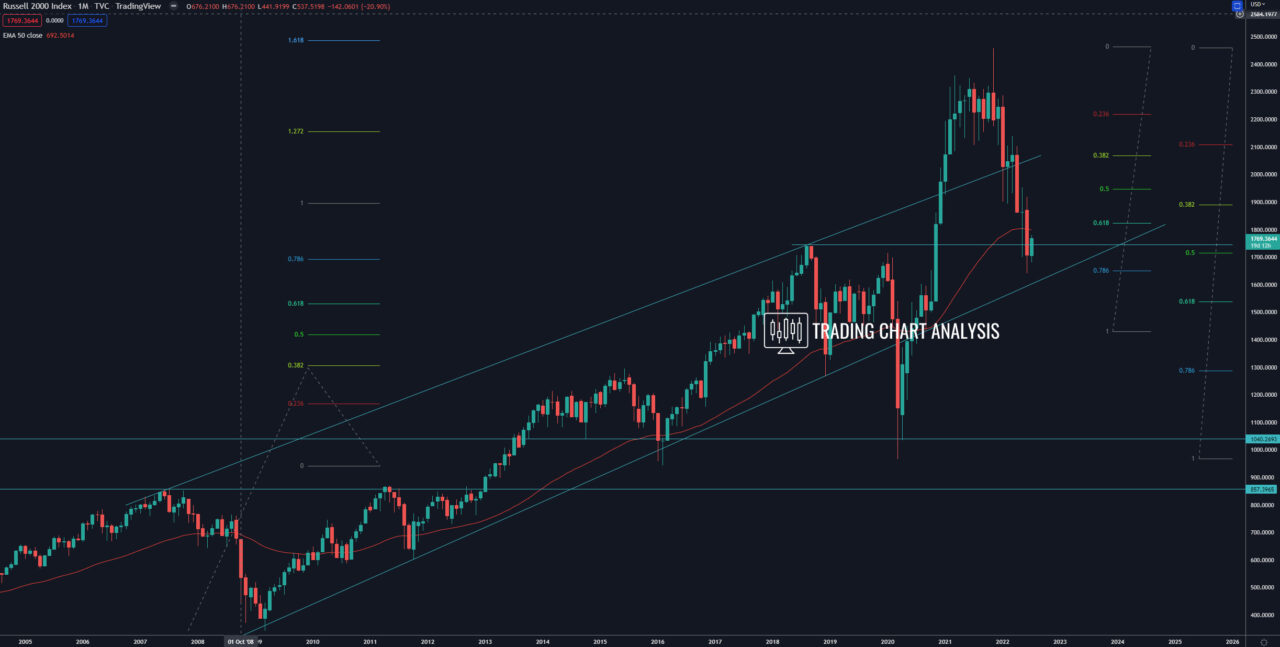
Looking at the bigger picture, the index Russell 2000 broke down in January 2022, starting a bearish wave on the weekly chart. The first target for the bearish wave is the 0.618 FIB retracement on the monthly chart at 1535. The second target is the 1.272 FIB extension on the weekly chart at 1420.
Daily chart:

Weekly chart:

Monthly chart:


