|
Getting your Trinity Audio player ready...
|
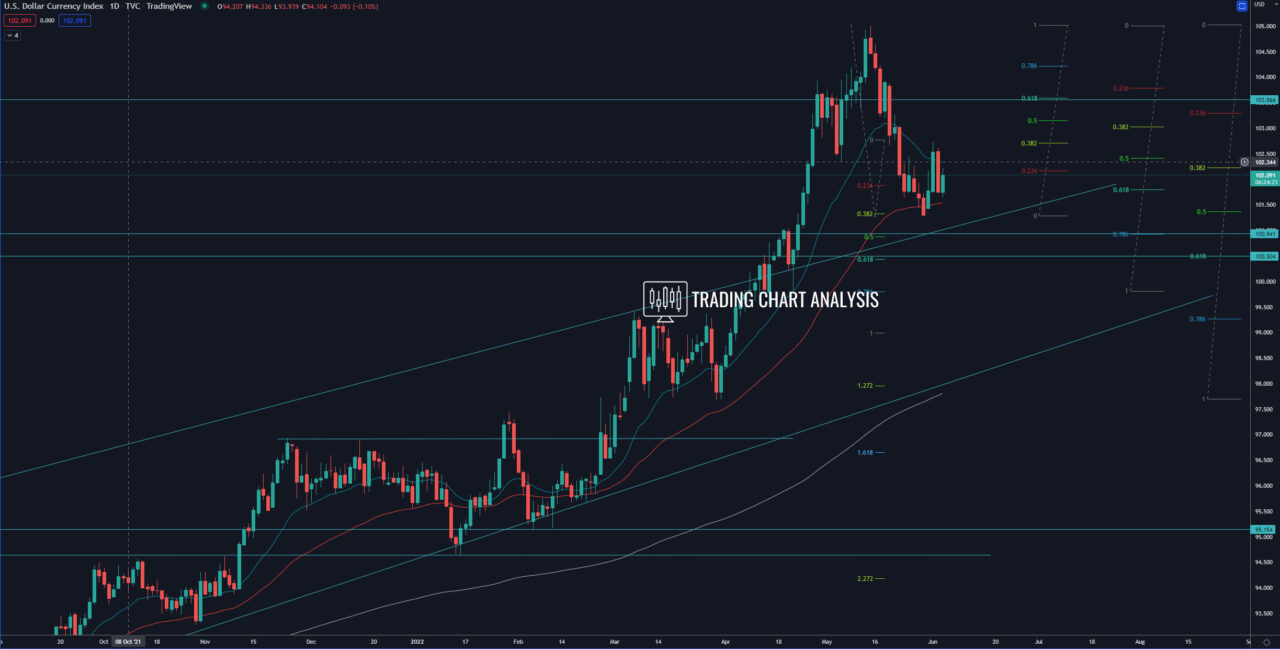
Technical analysis for the dollar index DXY, the index bounced from the daily 50 EMA, starting a pullback on the daily chart. If the index break above the previous daily high at 102.73, which is the 0.382 FIB retracement on the daily chart, that will send the DXY index higher toward the 0.618 FIB retracement on the daily chart at 103.60. And a break above 103.60 will open the door for a bullish run toward the previous weekly high at 105.00.
On June the 15th 2022 the Federal Reserve of the US will hike the interest rates. The expectation for the event should provide short-term support for the dollar index.
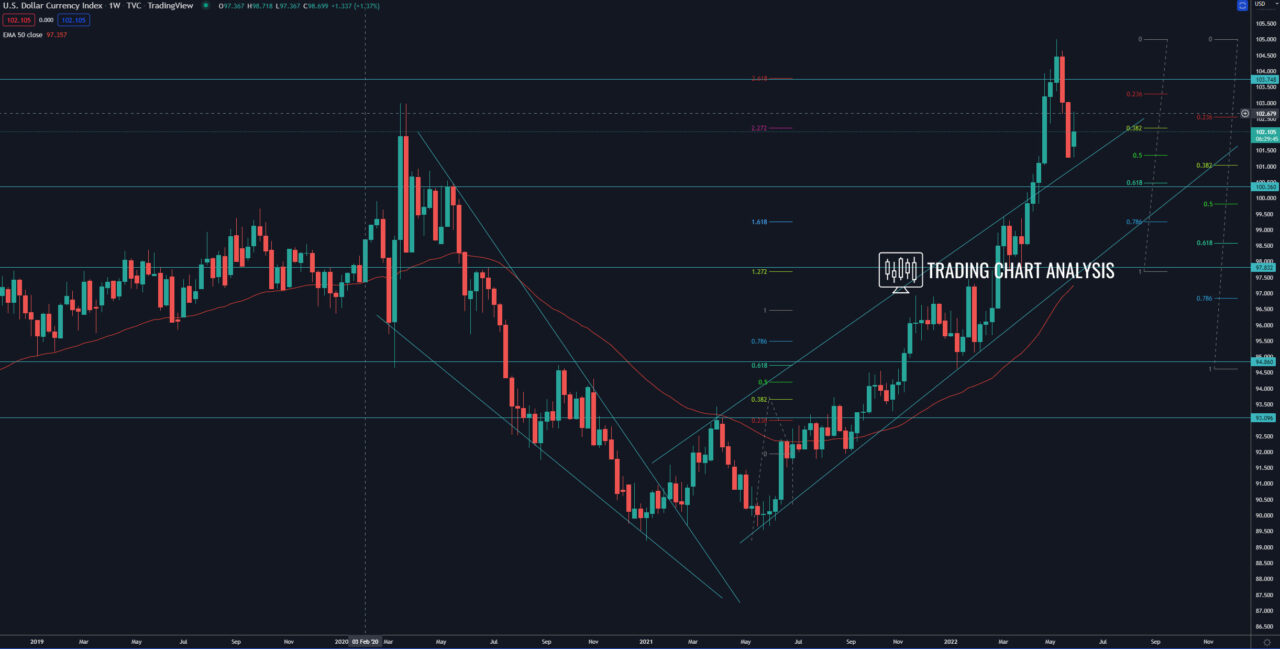
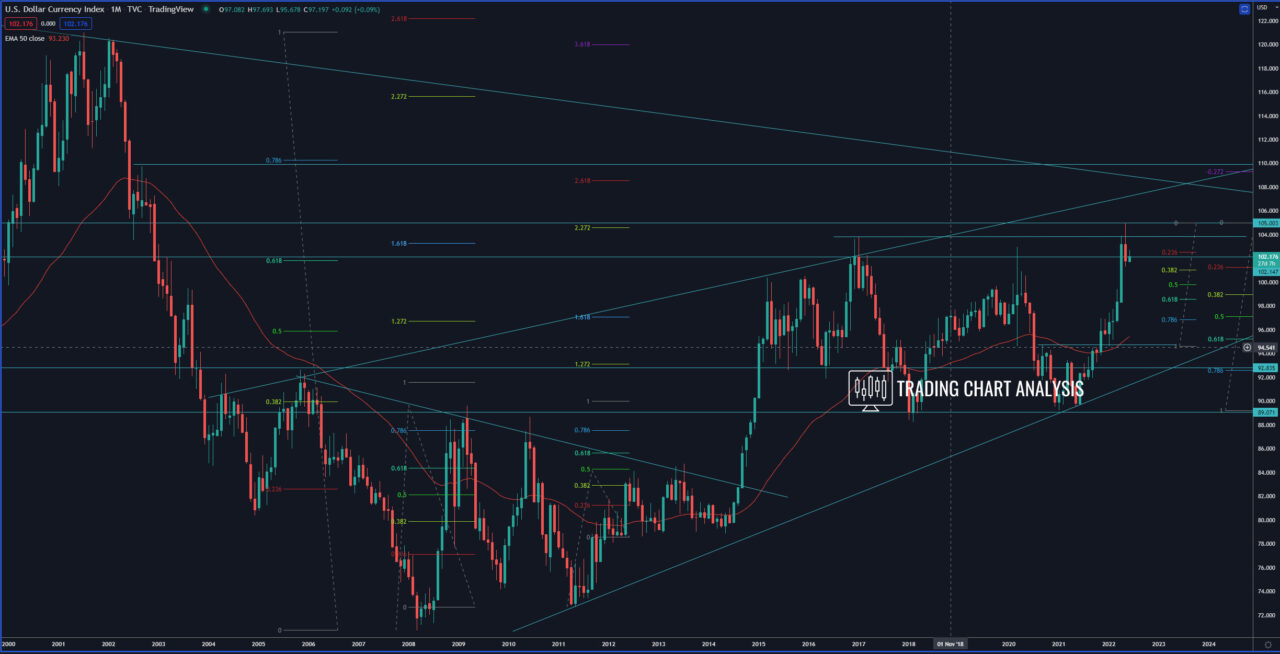
On the monthly chart, the DXY dollar index closed the month with a bearish inside bar rejecting resistance. On the daily chart, the dollar index closed below the 0.382 FIB retracement at 102.20. That opened the door for a bearish run toward the 0.618 FIB retracement on the daily chart at 100.50, but before that, we need to see a break below the daily 50 EMA and the daily low at 101.29. The second target for this potential bearish development is the 0.618 FIB retracement on the weekly chart at 98.55.
Daily chart:

Weekly chart:

Monthly chart:


