|
Getting your Trinity Audio player ready...
|
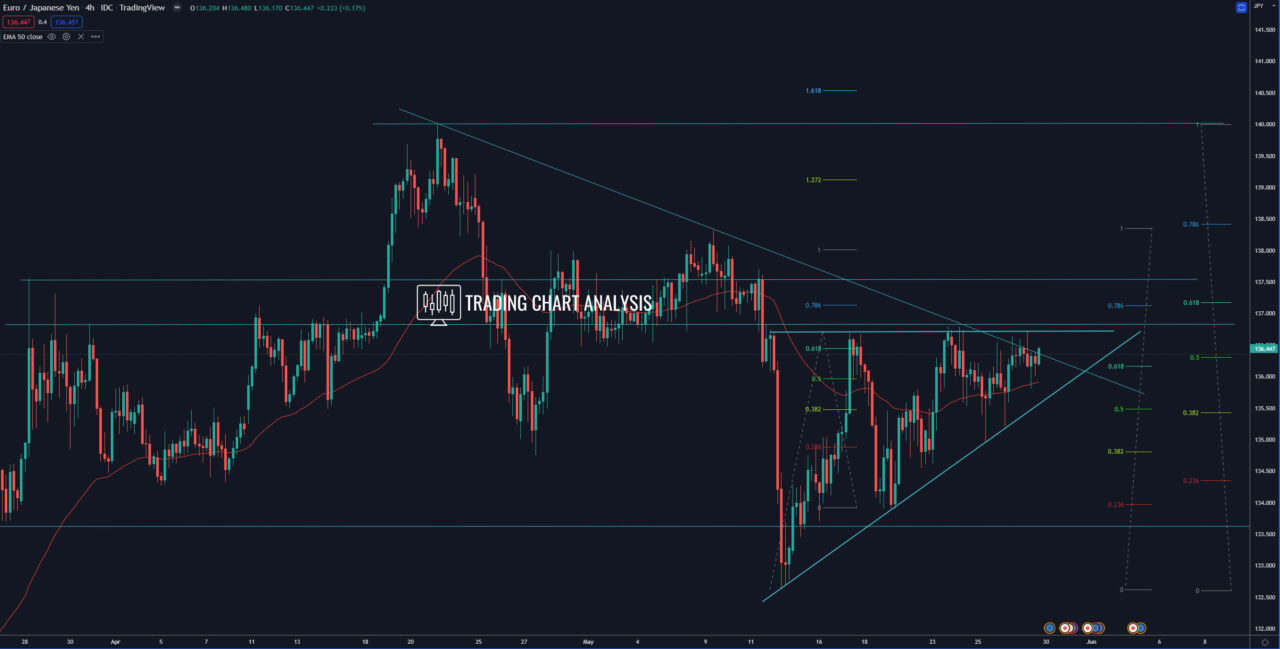
Technical analysis for EUR/JPY, the price formed ascending triangle on the four-hour chart, which is a signal for a potential bullish breakout. If the EUR/JPY breaks above 136.80, that will be a breakout of the ascending triangle and will send the price higher. The first target for this potential bullish breakout is the daily high at 138.31. The second target is the weekly high at 140.
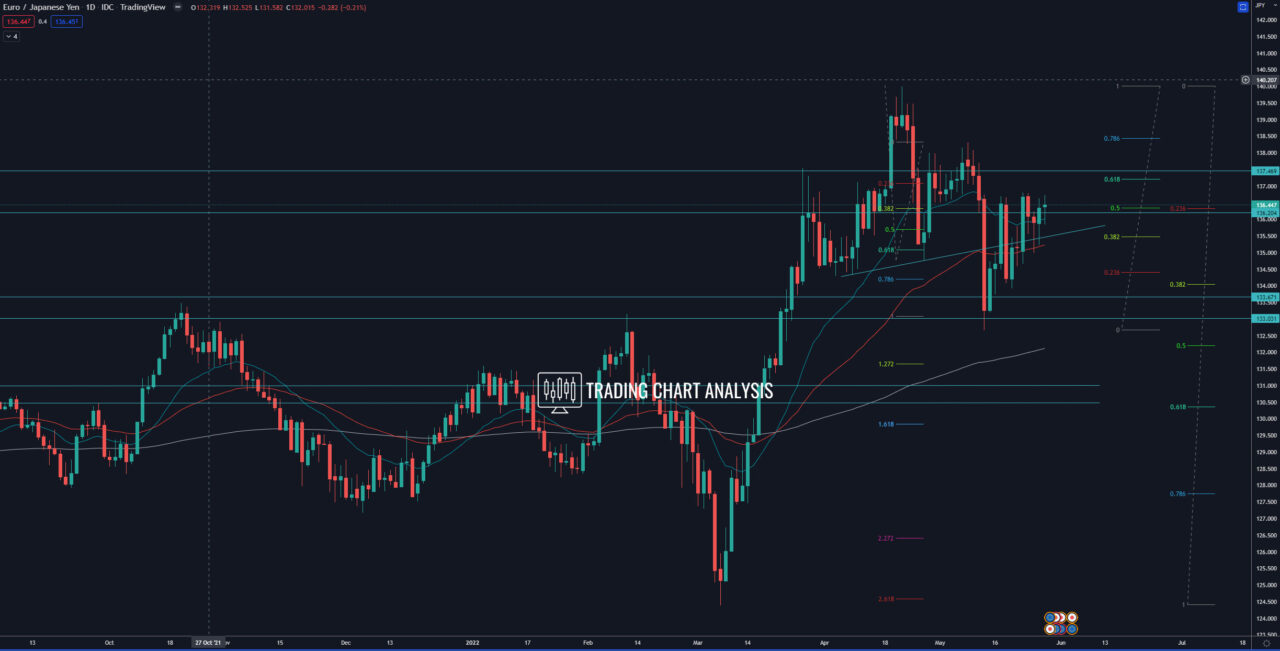
On the other hand, if the EUR/JPY breaks below the ascending trend line, part of the ascending triangle on the four-hour chart, that will send the price lower. The first target for such a bearish development is the 0.618 FIB retracement on the four-hour chart at 134.20. The second target is the daily low at 132.66. And if the EUR/JPY breaks below the previous daily low at 132.66, that will open the door for a bearish run toward the 0.618 FIB retracement on the weekly chart at 130.30.
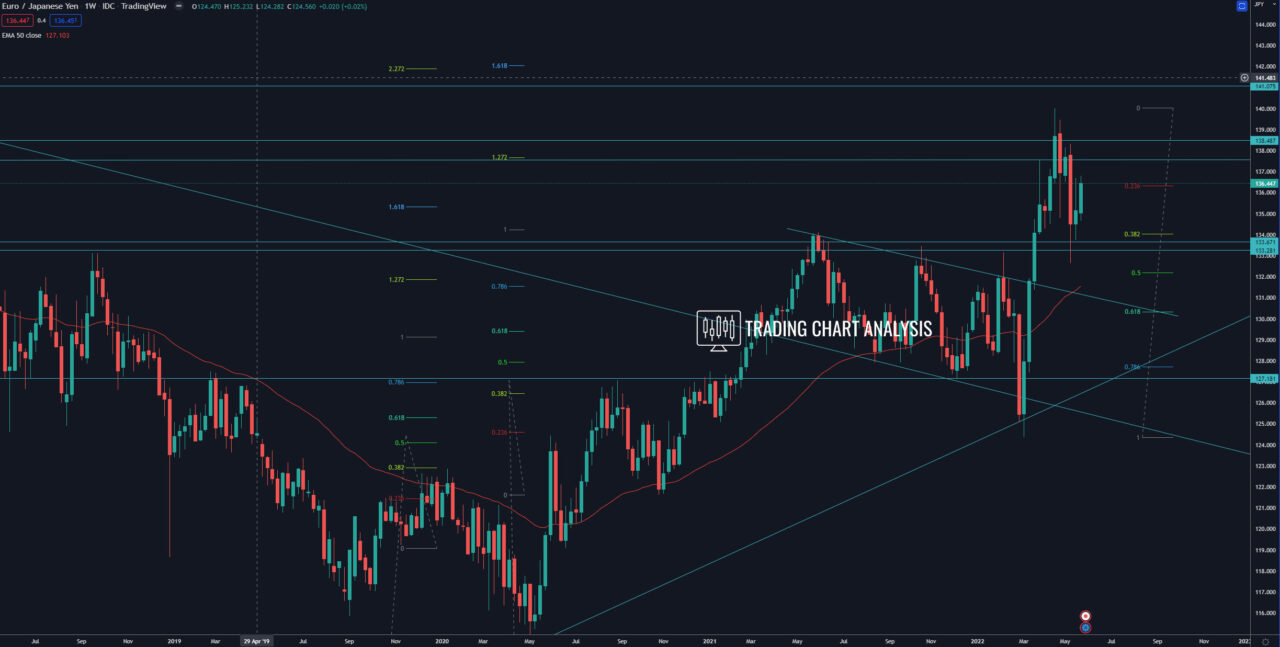
Looking at the bigger picture, the EUR/JPY reached the first target of the bullish wave on the monthly chart, the 1.272 FIB extension at 137.70. The price went as high as 140.00. The second target for the bullish wave is the 1.618 FIB extension on the monthly chart at 142.20, but before that, we need to see a break above 140.00.
Four-hour chart:

Daily chart:

Weekly chart:


