|
Getting your Trinity Audio player ready...
|
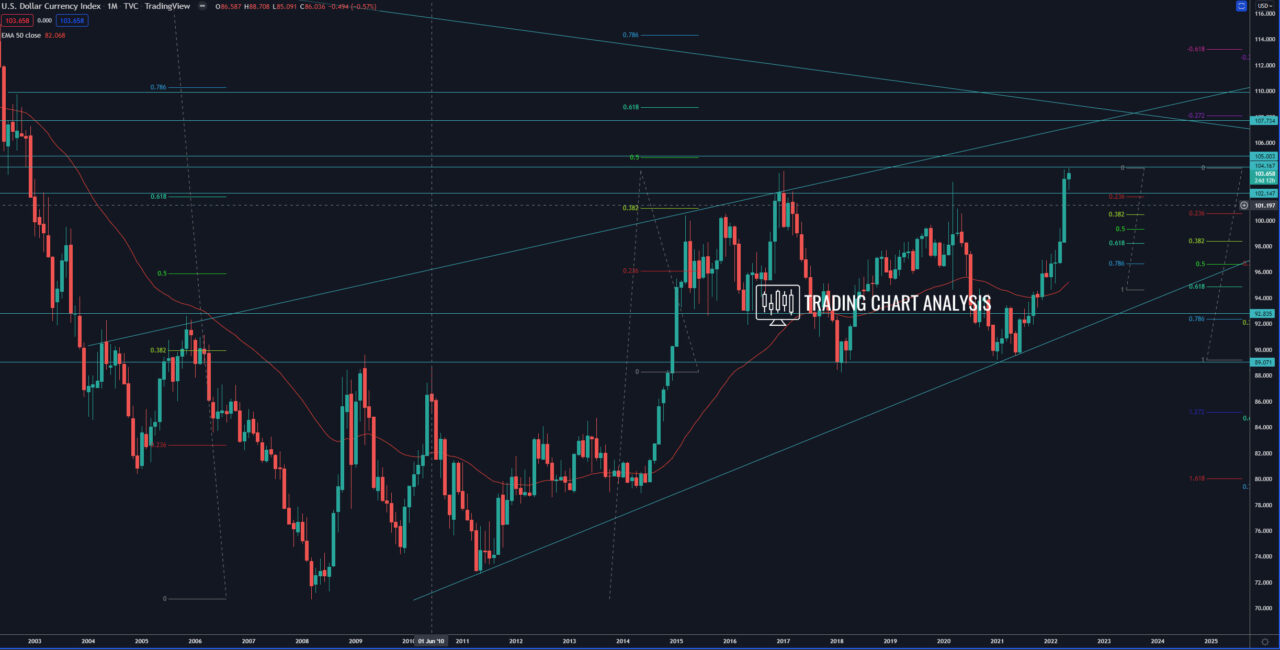
Technical analysis for the DXY, the index closed above the 0.618 FIB retracement on the monthly chart, a sign of further upside potential. This bullish development opened the door for a bullish run toward the 0.786 FIB retracement on the monthly chart at 110.20. However, before that, we need to see the DXY index closing and trading above the 2017 high at 103.82 and above the resistance zone between 104 – 105. After that, the next resistance zone for the index is around 107.70, where the dollar index is facing descending trend line, horizontal resistance, and top for a price channel on the monthly chart.
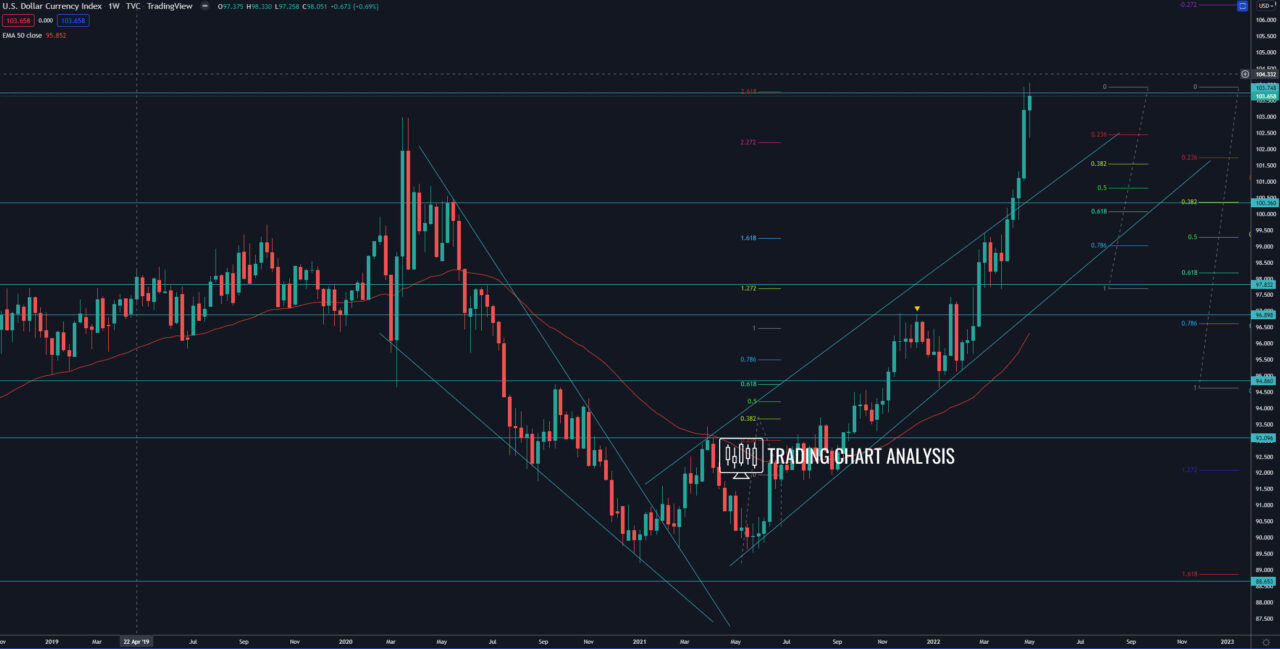
In a meantime, the DXY index is overbought on the weekly and the daily charts and within a resistance zone, which may be enough for a pullback. In case we see a rejection of the resistance and a pullback, the first target is the 0.382 FIB retracement on the daily chart at 102.45. The second target is the 0.618 FIB retracement on the daily chart and the 0.382 FIB retracement on the weekly chart at 101.55. The third target is the 0.618 FIB retracement on the weekly chart at 100.00 and the low on the daily chart at 99.81.
Monthly chart:

Weekly chart:


