|
Getting your Trinity Audio player ready...
|
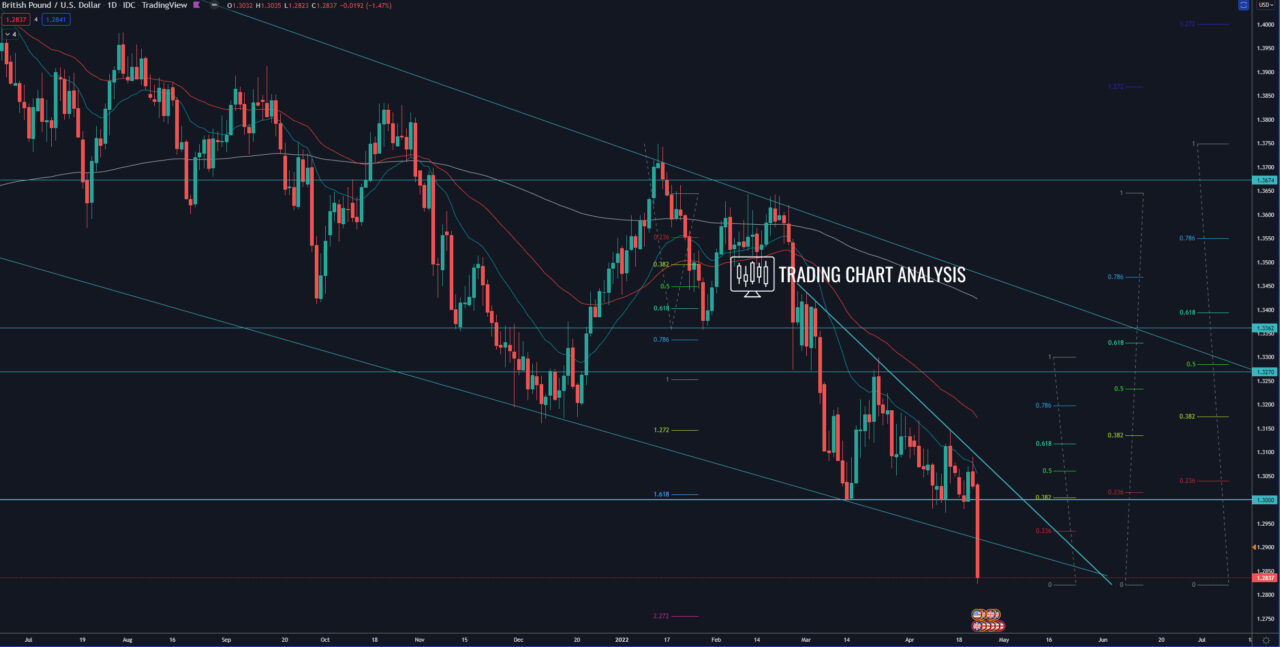
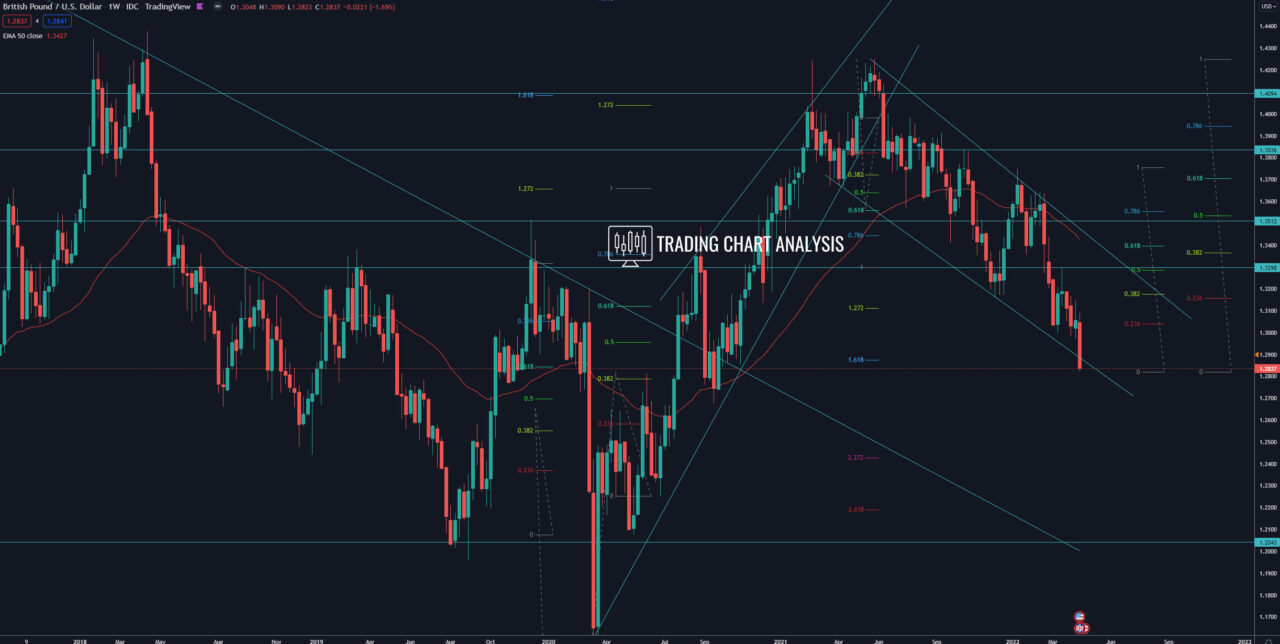
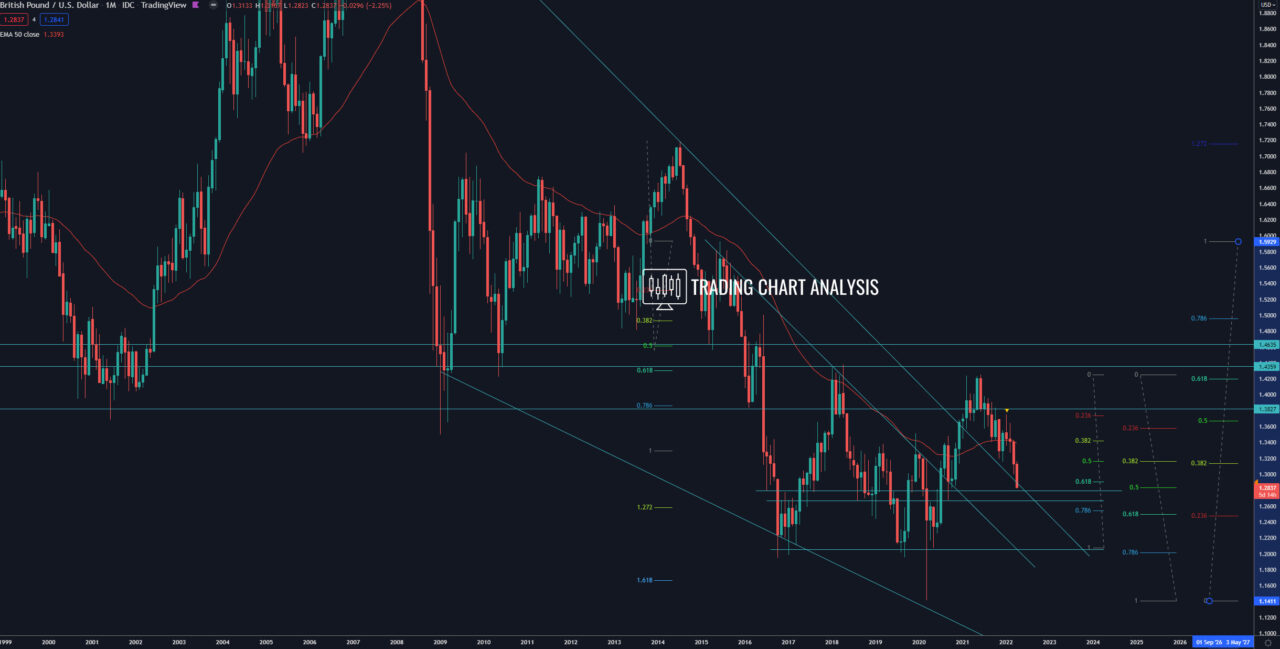
Technical analysis for the GBP/USD, the price broke below a descending triangle on the daily chart. This breakout accelerated the decline toward the second target of the bearish wave on the weekly chart, the 1.618 FIB extension at 1.2875. The price went as low as 1.2820, just below the 0.500 FIB retracement on the monthly at 1.2835. This breakout opens the door for a bearish run toward the 0.618 FIB retracement on the monthly chart at 1.2500 and toward the 2.272 FIB extension on the weekly chart at 1.2430. However, since the price of GBP/USD reached a support zone, the 0.500 FIB retracement on the monthly chart, and the target of the bearish wave on the weekly chart, we may see consolidation and pullback before the next leg down.
In case of a pullback for the GBP/USD, the first resistance is the base of the triangle at 1.3000. The second resistance is the previous high on the daily chart at 1.3090. The third target is the 0.618 FIB retracement on the daily chart at 1.3120. Key resistance is the previous high on the weekly chart at 1.3299.
Daily chart:

Weekly chart:

Monthly chart:


