|
Getting your Trinity Audio player ready...
|
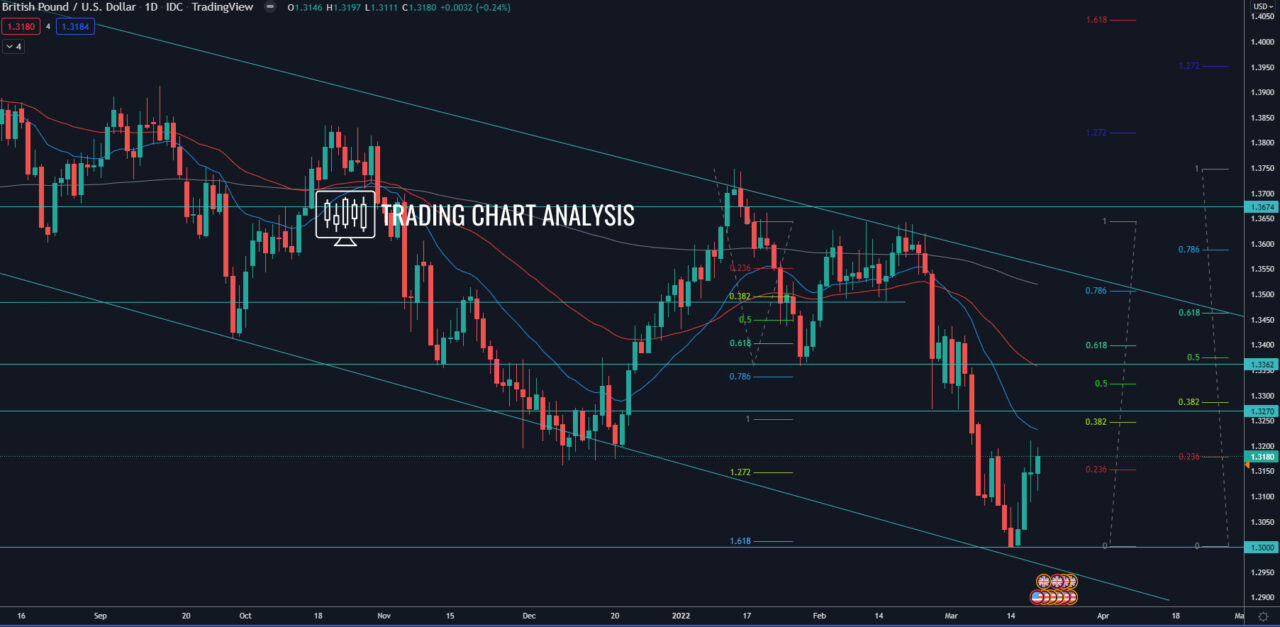
Technical analysis for the GBP/USD, the pair has completed the latest bearish run on the daily chart and hit the second target of that run, the 1.618 FIB extension at 1.3110. The GBP/USD closed the week with a bullish inside bar, signaling a pullback. If the pair breaks above the high at 1.3195, it will open the door for a bullish run. The first target for this potential bullish run for the GBP/USD is the 0.382 FIB retracement on the weekly chart at 1.3290. The second target for the GBP/USD is the 0.500 FIB retracement on the weekly chart at 1.3380. The third target is the 0.618 FIB retracement on the weekly chart at 1.3470, just above the high and resistance on the daily chart around 1.3435.
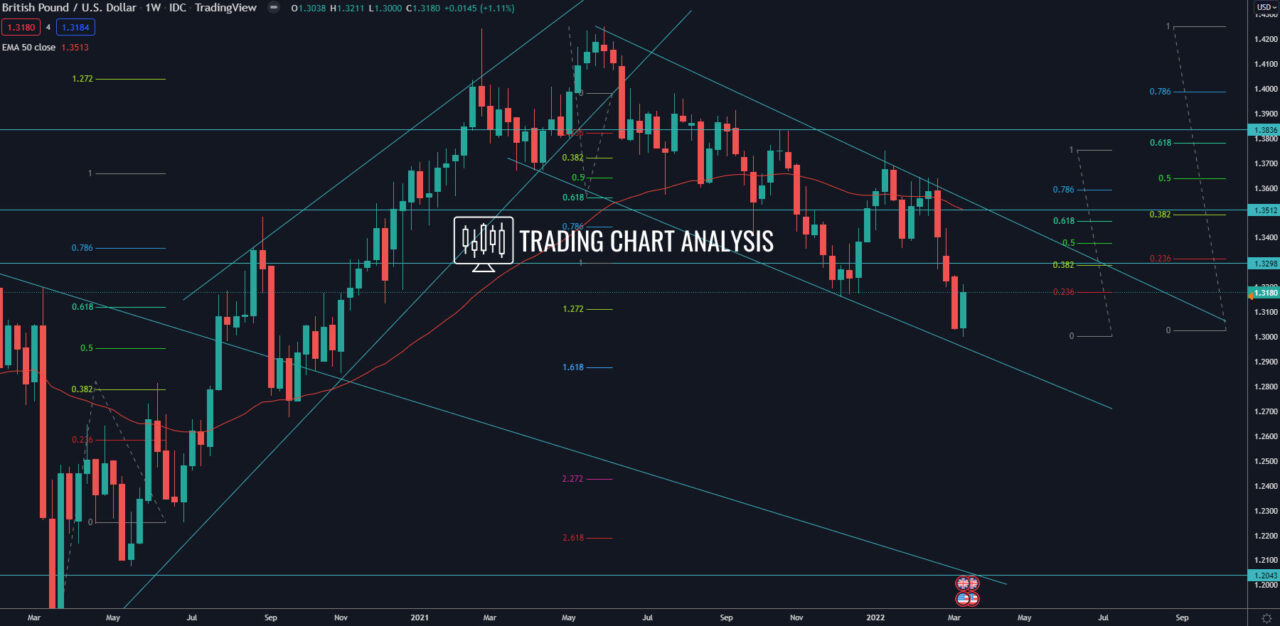
Looking at the bigger picture, the bearish wave on the weekly chart, which started after the break below the low at 1.3572, has not concluded yet. The second target for the bearish weekly wave for the GBP/USD is the 1.618 FIB extension at 1.2870-80, around the 0.500 FIB retracement on the monthly chart. Break below the previous low at 1.3000 will resume the bearish wave on the weekly chart and send the GBP/USD toward the target at 1.2880.
Daily chart:

Weekly chart:


