|
Getting your Trinity Audio player ready...
|
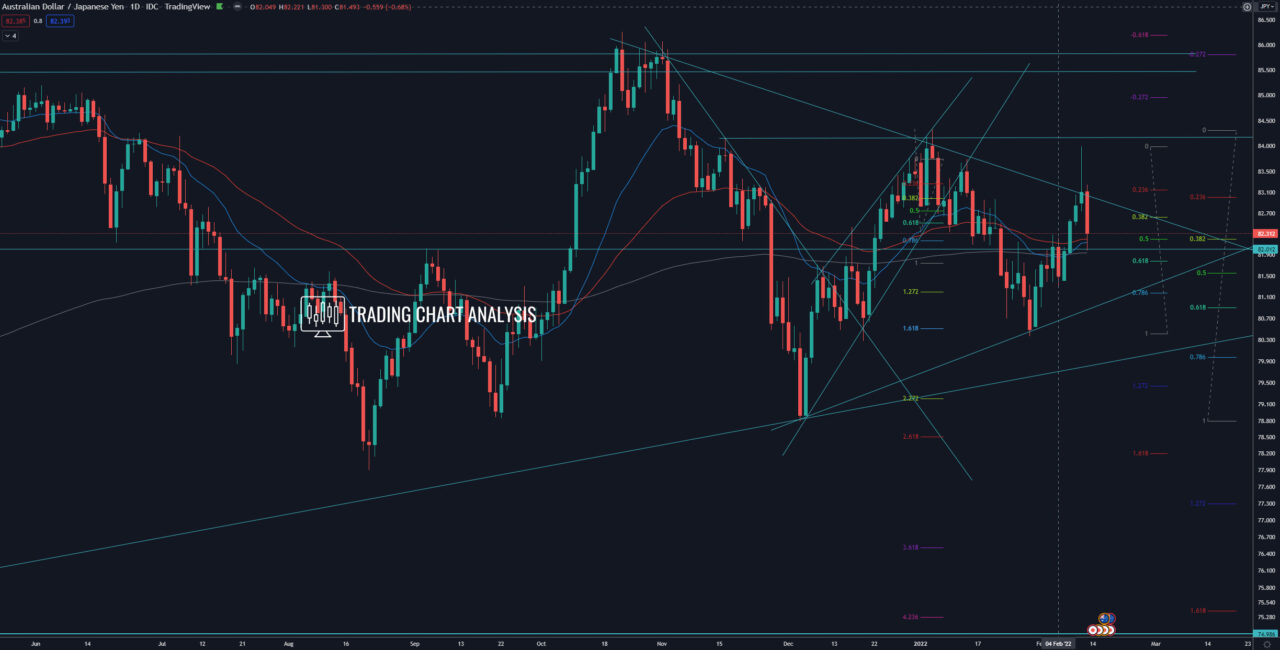
Technical analysis for AUD/JPY, the pair rejected resistance zone and descending trend line on the daily chart, forming an evening star candlestick pattern. However, the rejection was rather large and with strong momentum, which pushed the price lower to strong support. If the AUD/JPY breaks below the support zone between 82.00 – 81.75, where we have the 200 daily EMA, the 0.618 FIB retracement, that will be a signal for further declines. The first target for such a bearish development is the support at 81.30. The second target is the low on the daily chart at 80.36. And a break below 80.36 will send the AUD/JPY lower toward the 2.272 FIB extension on the daily chart at 79.20 and then toward the 2.618 FIB extension at 78.50.
On the other hand, if the AUD/JPY break above the descending trendline on the daily chart and above 83.00, that will open the door for a bullish run. The first target for this potential bullish run is at 84.00. A break above 84.00 – 84.33 will clear the way for a bullish run toward the previous daily high at 86.26.
Daily chart:

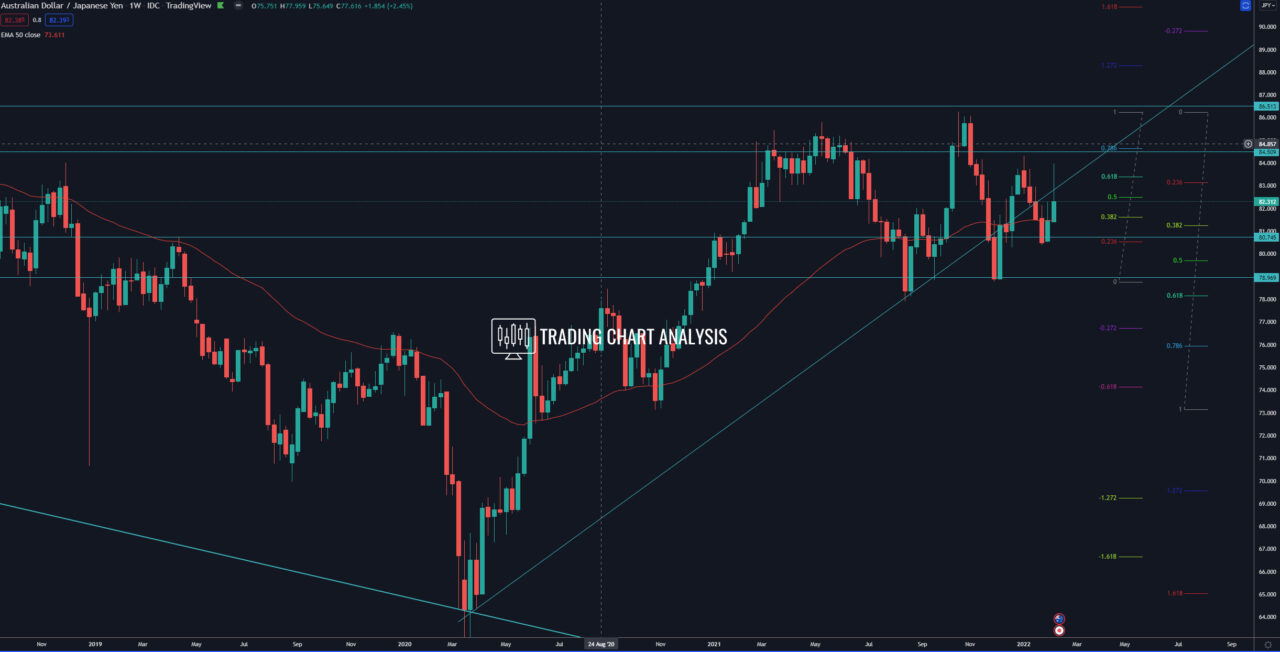
Weekly chart:


