|
Getting your Trinity Audio player ready...
|
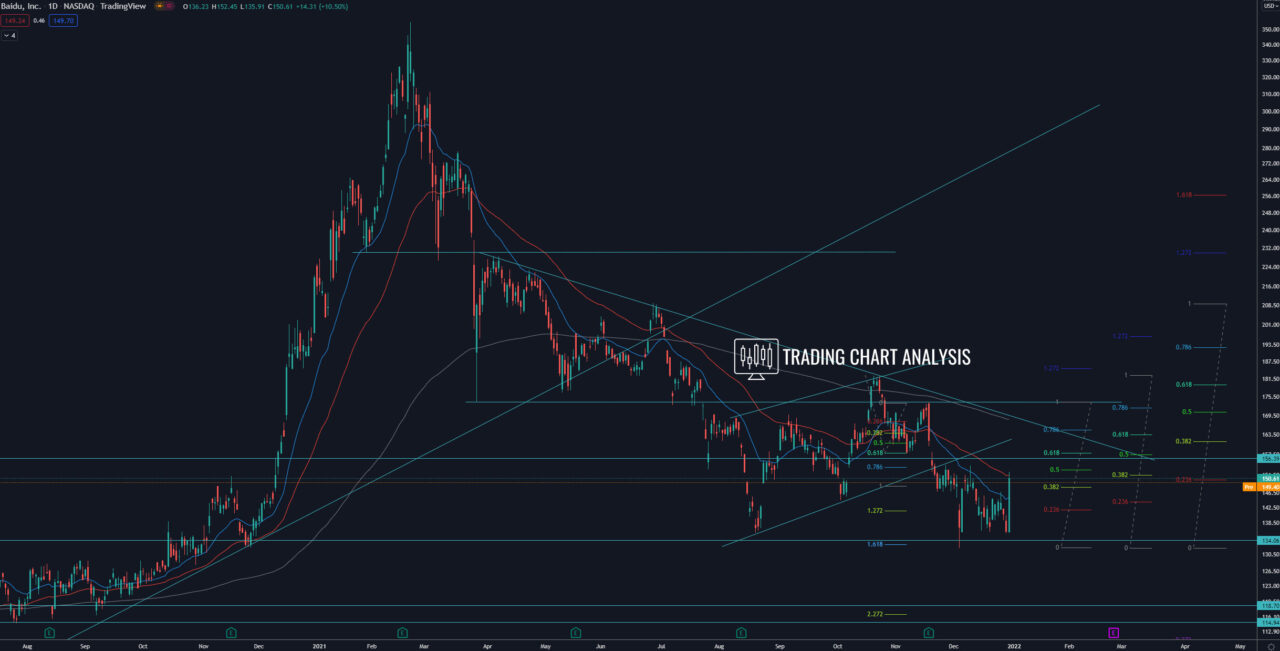
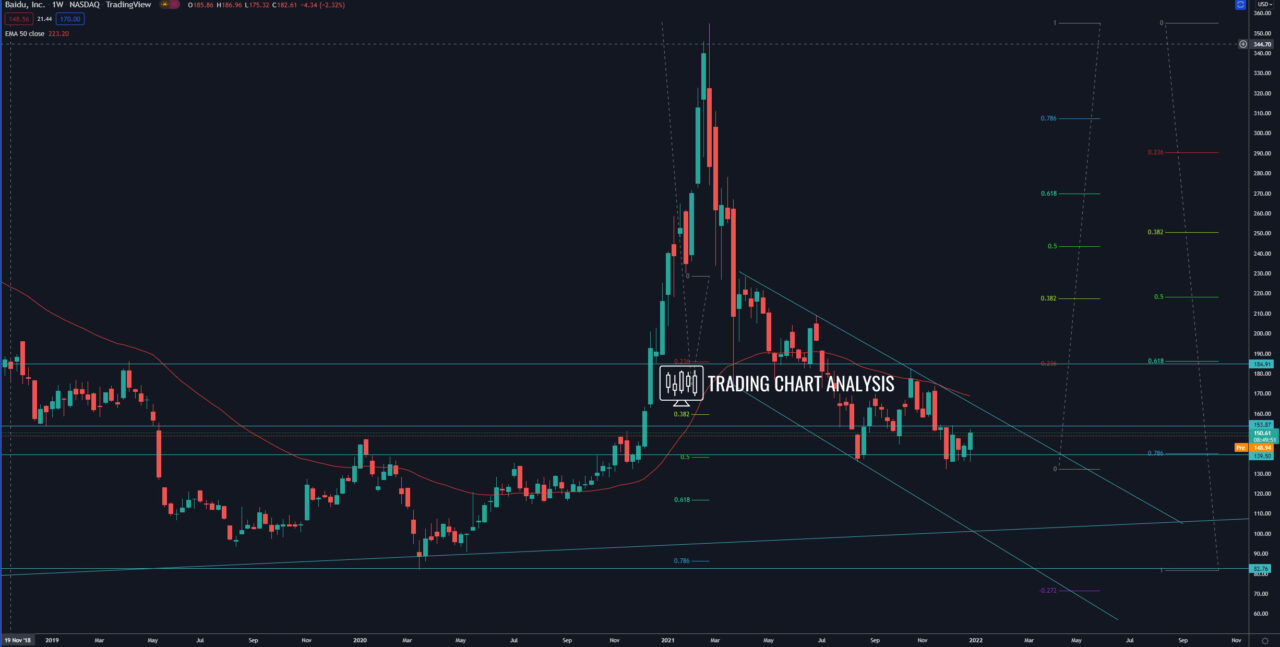
Technical analysis for Baidu, the shares are within their third daily bearish wave. The first target of this wave is the 1.272 FIB extension at 115$, which is the 0.618 FIB extension of the bearish weekly wave.
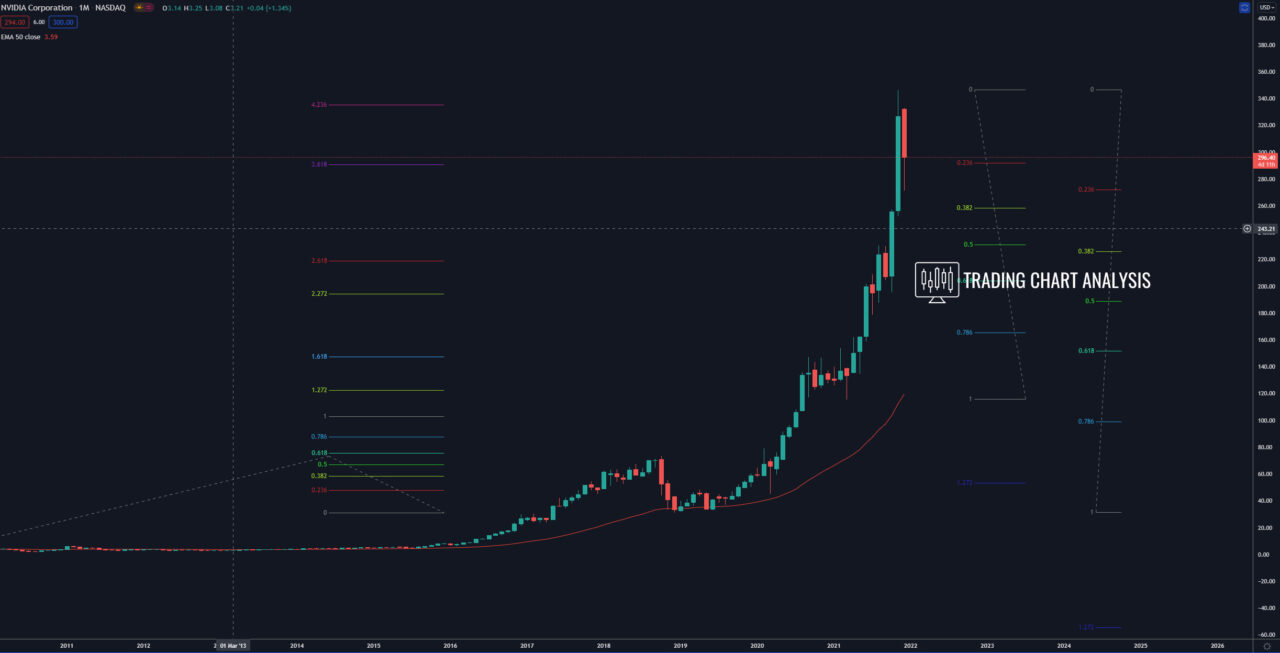
However, the shares of Baidu formed a double bottom on the weekly and the daily chart, rejecting a support zone. Also, on the monthly chart, the price is bouncing and holding above the 0.786 FIB and 0.618 FIB retracements. On the daily chart, we have MACD and RSI bullish divergence. All this is a sign for bottoming and the beginning of a pullback. The first target of this pullback, the 0.382 FIB retracement on the daily chart at 151$, is reached. If the shares of Baidu (BIDU) break above the daily 50 EMA and the 0.382 FIB retracement, it will send the price higher toward the 0.618 FIB retracement at 163$. And a break above 163$ will start a bullish run toward the resistance and high at 173$. The second target for this potential bullish breakout is at the high at 182.60$. And the third target is the 0.386 FIB retracement on the monthly chart at 215$.
Daily chart:

Weekly chart:

Monthly chart:


