|
Getting your Trinity Audio player ready...
|
Technical analysis for S&P 500, the index is within the fifth bullish wave on the daily chart. The first target for this bullish wave is the 0.382 FIB extension at 4975. The second target is the 0.618 FIB extension at 5400 and, that is our target for the S&P 500 index for 2022.
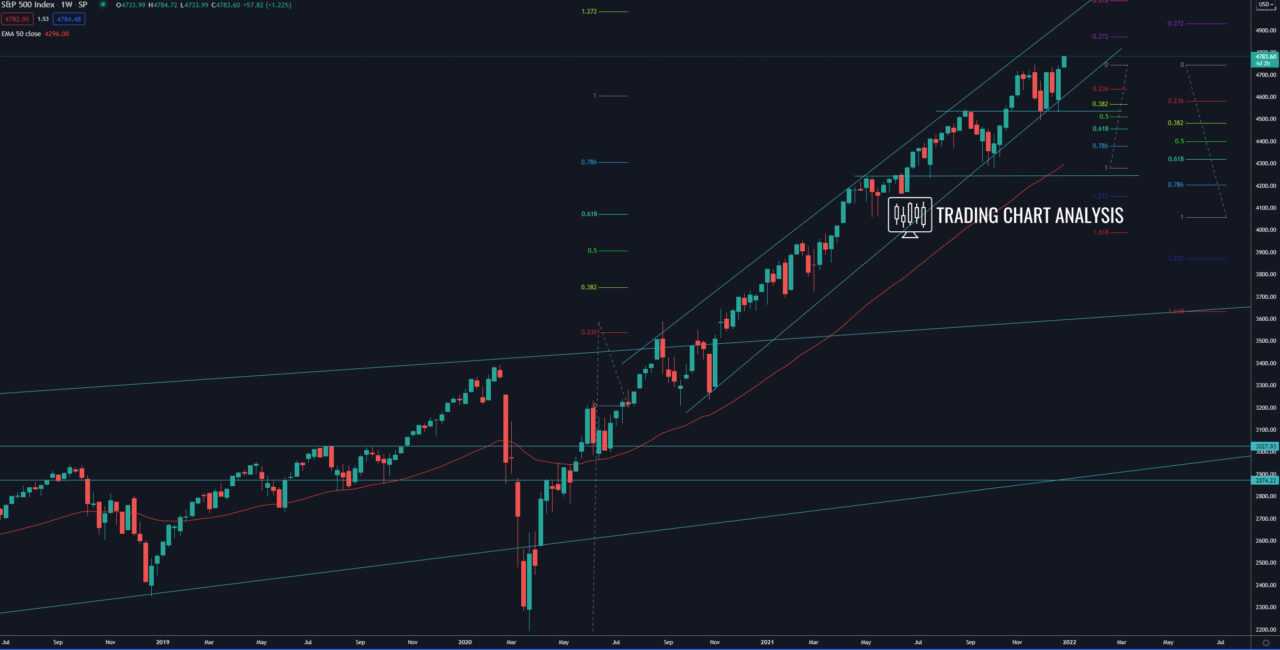
Looking at the weekly chart, the S&P 500 is within its third bullish wave. The first target for that bullish wave is the 1.272 FIB extension at 4980. The second target is the 1.618 FIB extension at 5470.
The quarterly chart for S&P 500 reveals that the index is within its third bullish wave. The third target of that wave is the 2.272 FIB extension at 5150. The fourth target is the 2.618 FIB extension at 5665.
The focus now is on the ascending price channel on the weekly chart. If the S&P 500 breaks below this price channel, that will trigger a pullback and eventually a correction. In that case, the support levels to watch are the support zone between 4545-4490 and the low at 4278.
Weekly chart:


