|
Getting your Trinity Audio player ready...
|
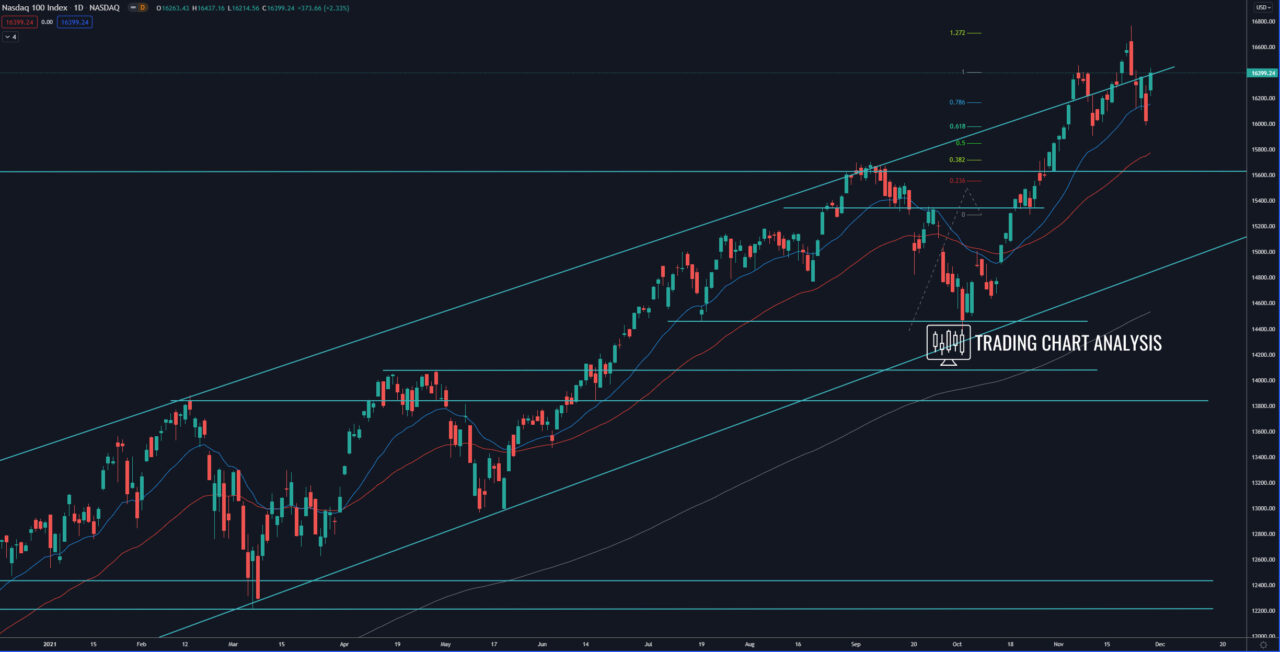
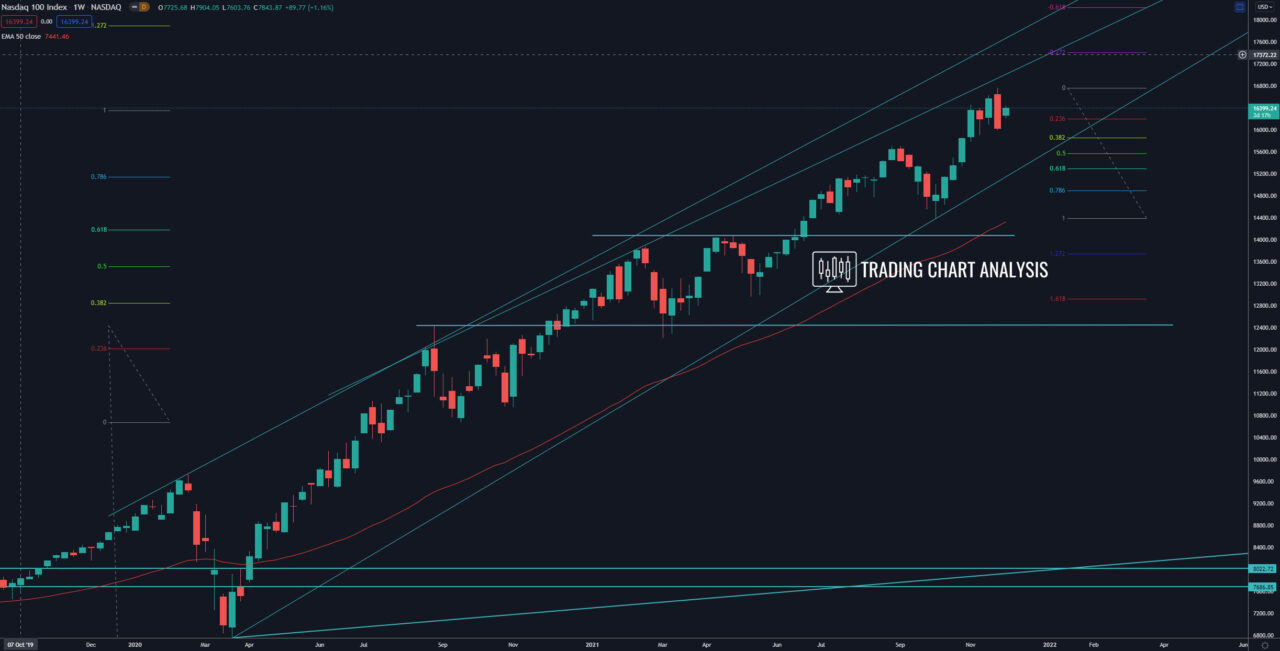
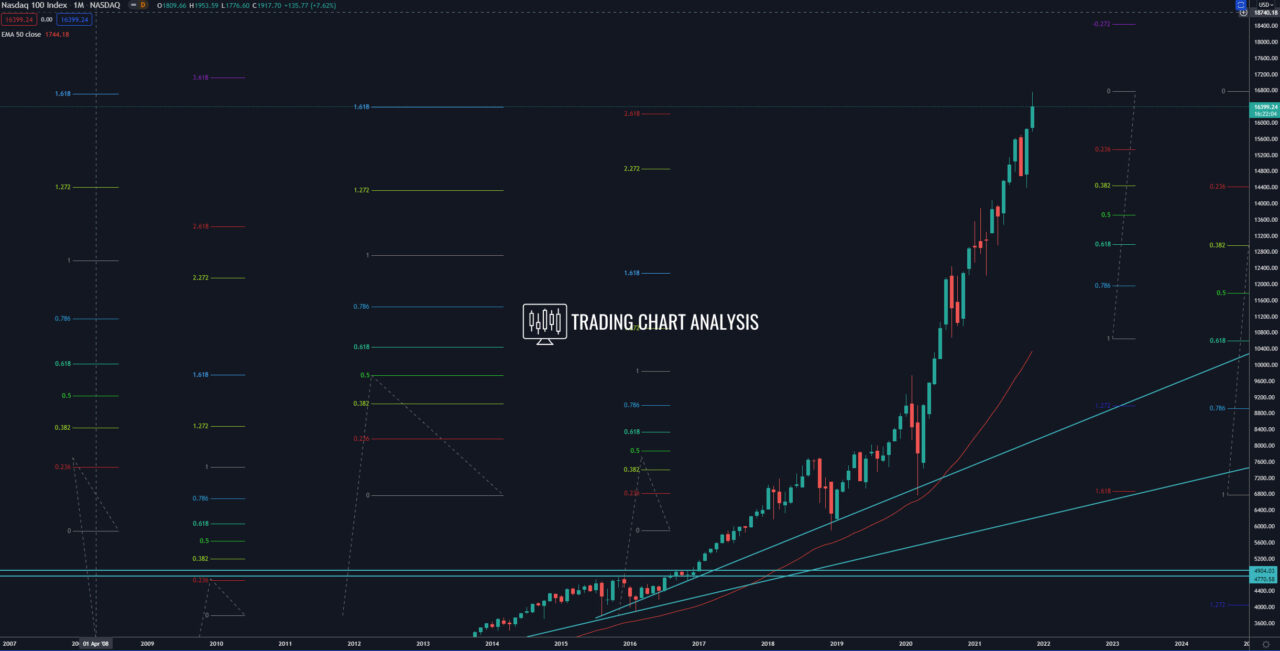
Technical analysis for NASDAQ 100, the index reached FIB extension levels on the monthly chart between 16 225 – 16 700 and rejected them with bearish engulfing on the weekly chart. On the daily chart at the top of an ascending price channel on the daily chart, the index NASDAQ 100 forms a Head & Shoulders pattern. If the NASDAQ 100 breaks below the neckline of the Head & Shoulders, breaks below 16 000 it will open the door for a bearish run. The first target of this potential breakdown is the 0.618 FIB retracement on the daily chart at 15 300. The second target is the support zone between 2.272 and 2.618 FIB extension at 14 400.
On the other hand, if the NASDAQ 100 breaks above the 0.618 FIB retracement at 16 470, it will signal a resumption of the bullish trend and send the index higher for a retest of the previous high at 16 764. A break above 16 764 will open the door for a run toward the 1.618 FIB extension on the daily chart at 17 090 – 17 100.
Daily chart:

Weekly chart:

Monthly chart:


