|
Getting your Trinity Audio player ready...
|
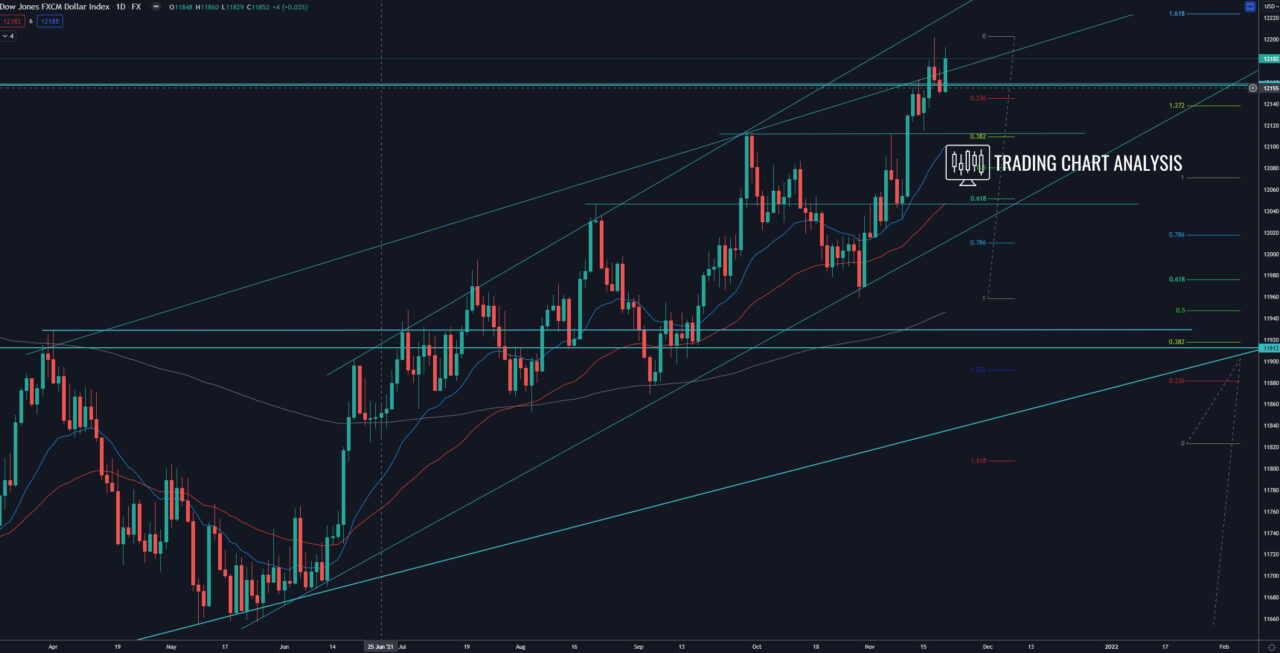
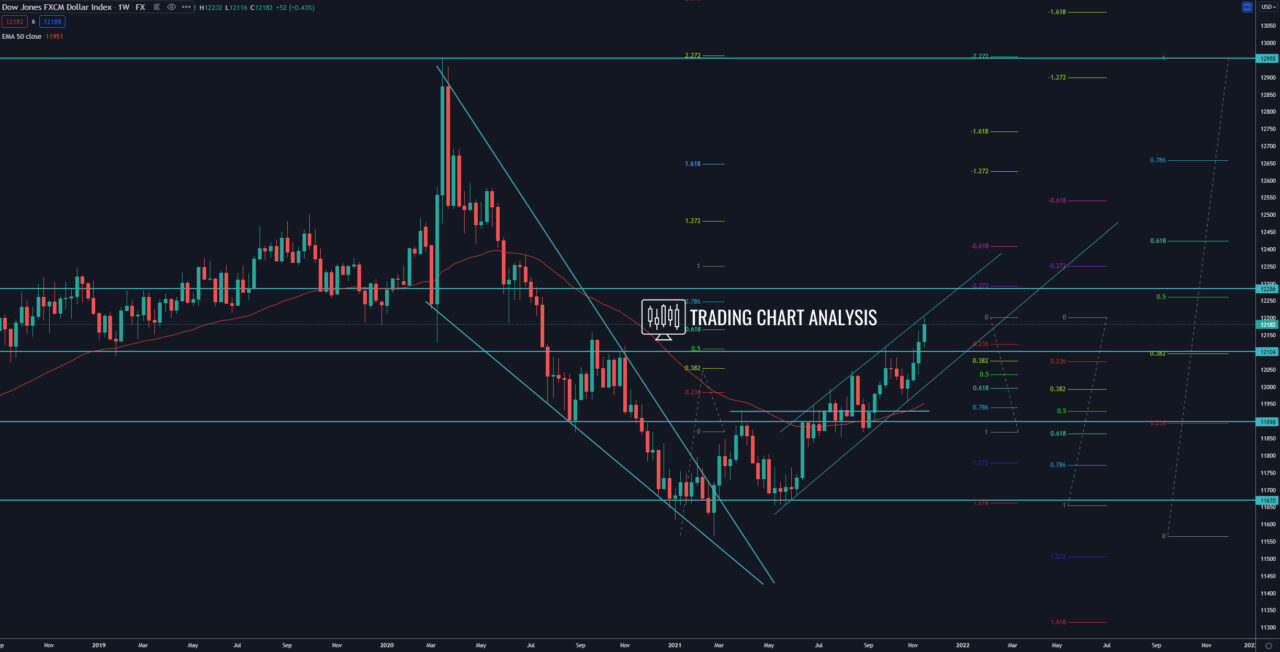
Technical analysis for the FXCM dollar index, the index broke out to the upside, a signal for further upside potential. The index closed above the 0.386 FIB retracement and the September 2020 high at 12 158 on the daily and the weekly charts. This breakout opened the door for a bullish run toward the 0.618 FIB retracement at 12 425.
The focus for the week ahead is at 12 202, on the high-test candle, which the index formed last week on the daily chart. If we see a break above 12 202, it will send the index higher, toward first the 1.618 FIB extension at 12 225. The second target will be the 1.618 FIB extension on the weekly chart at 12 240, and the third target is the 0.500 FIB retracement at 12 260.
The support and 0.386 FIB retracement at 12 110, should be monitored for bounce and resumption of the bullish trend. If the FXCM dollar index break below 12 110, it will open the door for a pullback toward the 0.618 FIB retracement at 12 050.
Daily chart:

Weekly chart:


