|
Getting your Trinity Audio player ready...
|
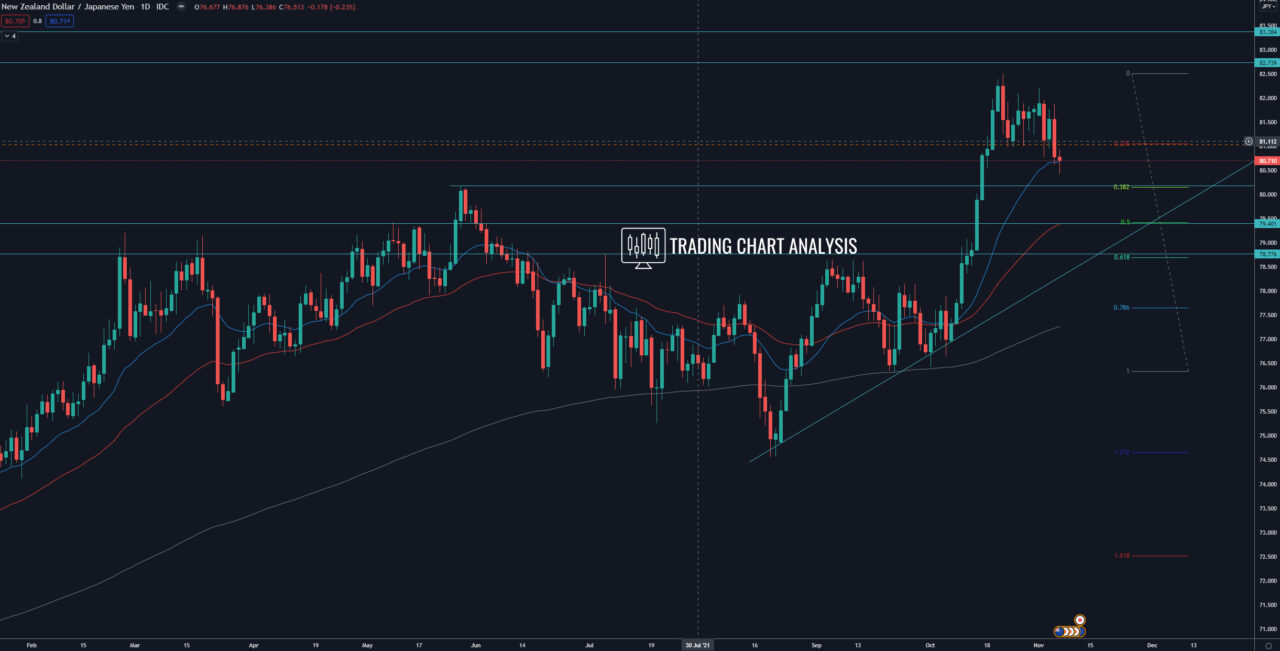
Technical analysis for the NZD/JPY, the pair breakout of consolidation on the four-hour and the daily chart and started a pullback on the daily chart. The first target of the breakout on the four-hour and daily chart is the 0.386 FIB retracement at 80.10. The second target is the range between 1.618 FIB extension at 79.60 and the 0.500 FIB retracement at 79.40. However, the price action looks corrective, and the monthly and the weekly charts are bullish.
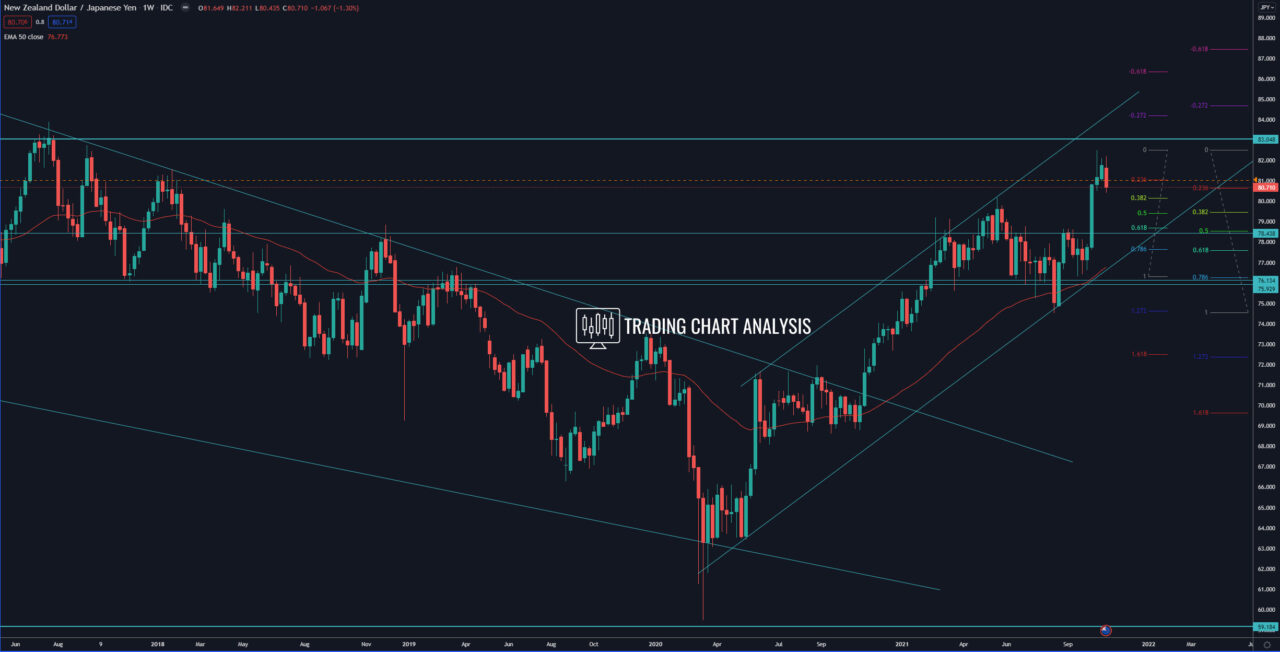
Looking at the bigger picture, the break above the previous high at 80.18 is a sign for a resumption of the third bullish weekly wave for the NZD/JPY. The first target of this wave is the 1.272 FIB extension at 83.60, where we have an important resistance zone.
Daily chart:

Weekly chart:


