|
Getting your Trinity Audio player ready...
|
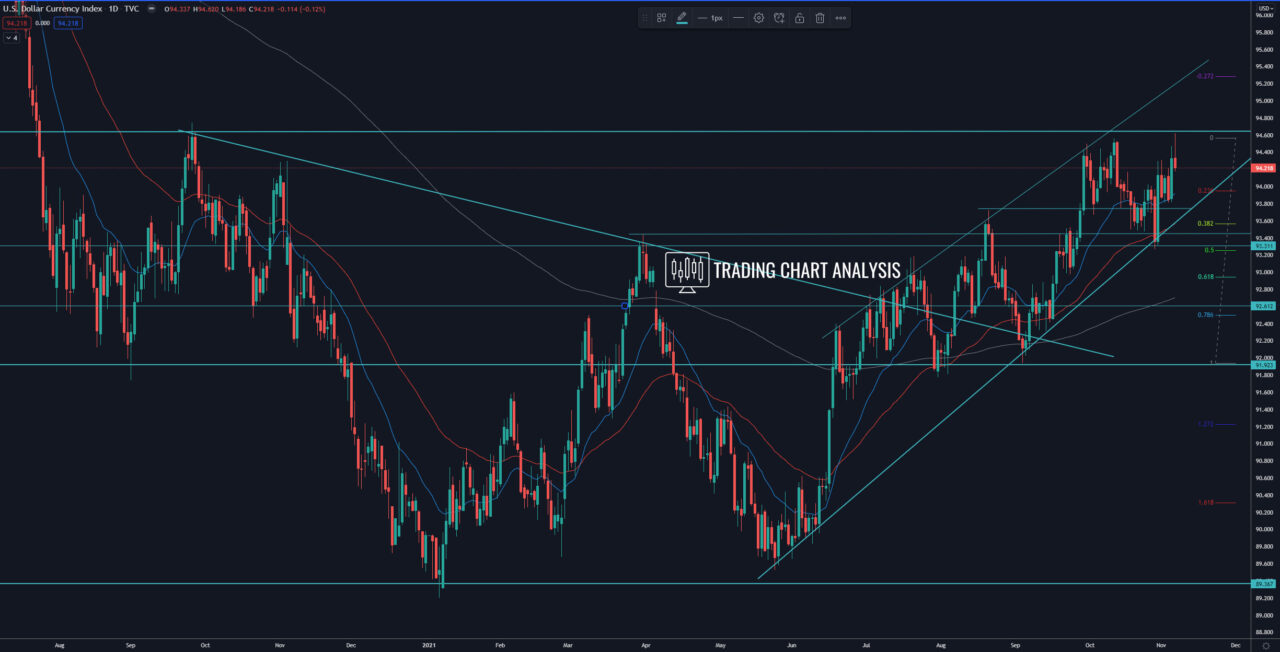
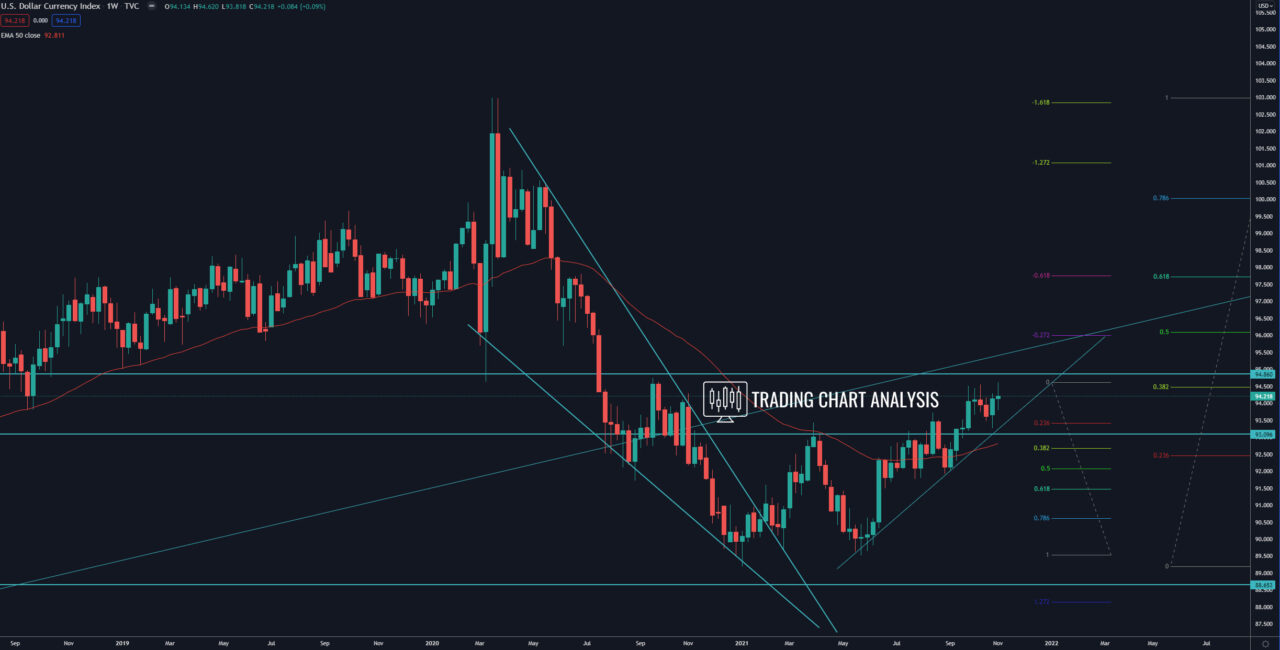
Technical analysis for the DXY dollar index, the index closed with high-test candle on the daily chart, rejecting resistance zone and 0.386 FIB retracement at 94.50. The DXY index formed a double top, which is an early sign for potential declines. The focus now is on the ascending price channel on the daily chart. If the DXY index breaks below the price channel, it will open the door for a decline toward the previous low and support at 93.28. A breakout below 93.28, will send the DXY index lower toward the 0.386 FIB retracement at 92.65, and eventually toward the low at 91.93 and 0.618 FIB retracement at 91.50.
On the other hand, if the DXY index breaks above the 0.386 FIB retracement and the high from September 2020 at 94.74, it will have bullish implications and send the index higher toward the 0.618 FIB retracement at 97.70.
Daily chart:

Weekly chart:


